Golden Data · Paul Brown · Ogden, Utah
One revenue number your whole team trusts.
Before you hire a director of analytics, hire the work. I build the pipeline, forecast, and capacity systems that hire would spend their first year on — in 90 days, on your data. Then my agents keep them current.
Founding rate: the first 3 builds run $15,000, half the list price, in exchange for a named case study.
Which one is you?
- I run the business. The numbers live in a spreadsheet and QuickBooks.Two hours on your own bids and invoices, and a page you keep. $1,500, fixed.The read →
- I lead revenue. The forecast keeps missing and every deck has its own number.The pipeline, forecast, and capacity systems, built in 90 days on your data. $30,000.The build →
- We pay for Tableau seats and a person to keep the workbooks alive.Run your seat count against the build and the bench. The page says stay when staying is cheaper.The arithmetic →
- We have an analytics director req open, and it has been open a while.The same build, handed to your new director on day one, or instead of the req. Then $3,000/mo keeps it current.The build →
- 14 years
- Business intelligence, then ad tech revenue operations. Today I lead sales operations.
- Eight figures
- Of pipeline recovered with propensity models on enterprise sales channels.
- Fintech at scale
- Governed data models and the semantic layers a whole company reads from.
- Kept current
- 48 datasets feed this site; 10 stay live with no one at the keyboard. The map traces every one and says which are behind.
The proof, in the open
Tools you can use now, dashboards built on public data, shipped work, and two weekly letters, published as I build them. Everything on the bench runs on real data.
Nothing on the bench matches that yet.
Try a tool, a dataset, or a topic — ‘eval’, ‘salary’, ‘nuclear’, ‘gif’.
Golden Data / Tools
Small tools for the work I actually do
Pipeline coverage and capacity math from the revenue-ops day job, cost caps and eval sizing for AI features, house rules for prose — plus a few built for my own life. No login, no tracking, no email wall.
Pick a tool
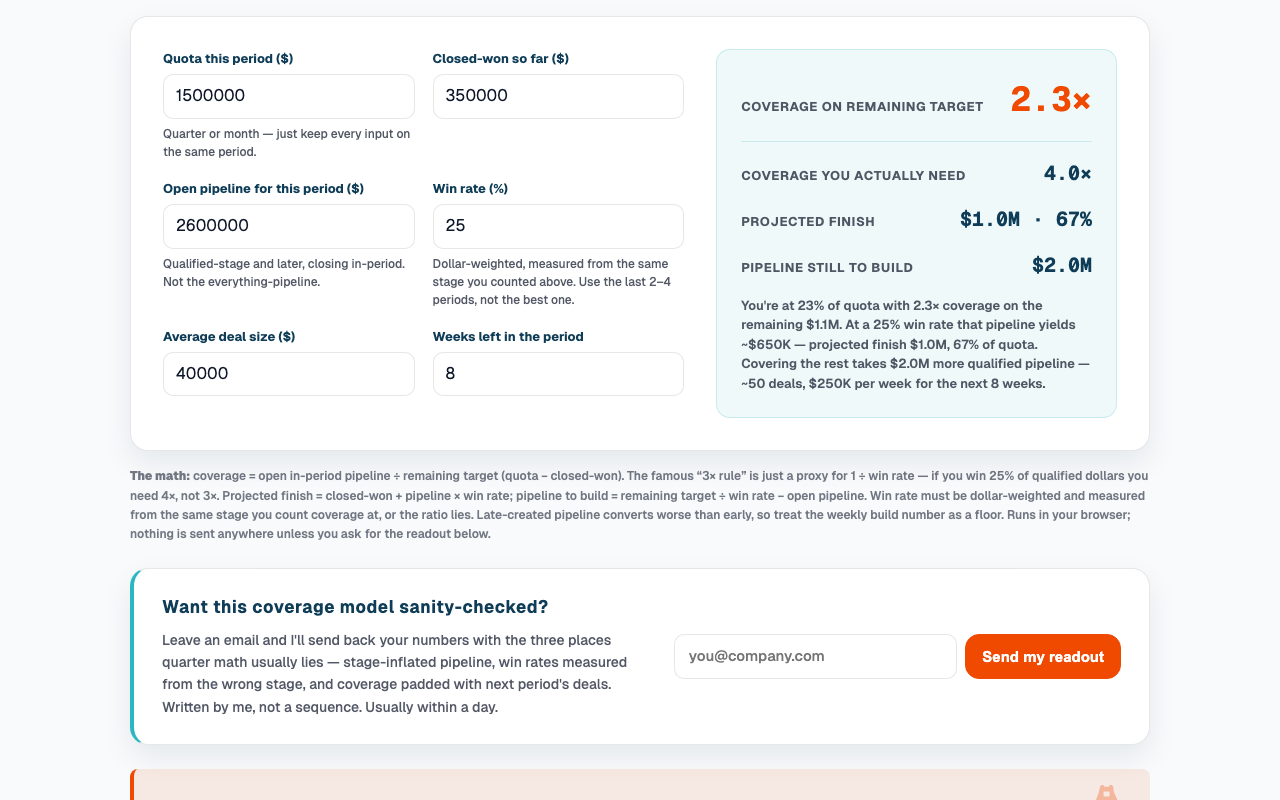
Pipeline Coverage Planner
Quota, closed-won, open pipeline, and win rate in — coverage ratio, projected finish, and the pipeline you still have to build (in deals, per week) out. The quarter math, without the spreadsheet.
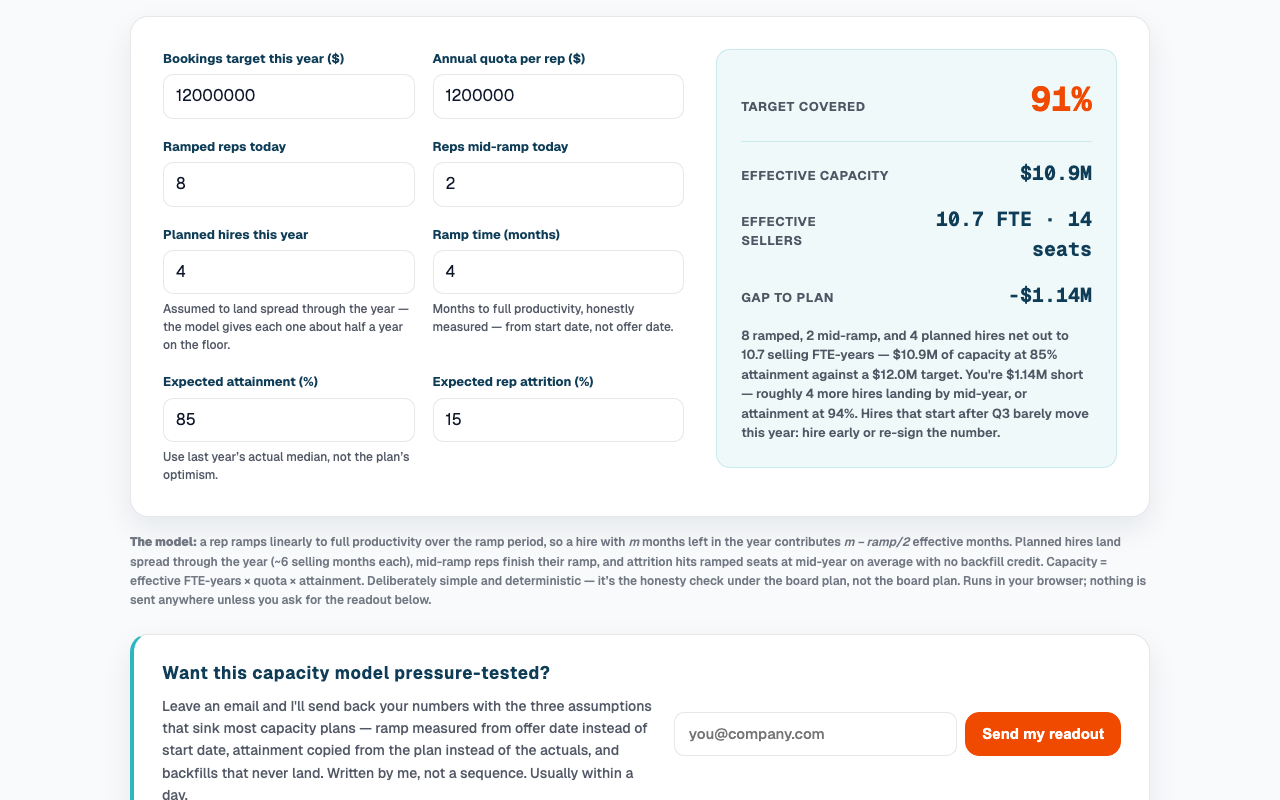
Sales Capacity Planner
Will the team you have hit the number you signed up for? Reps, ramp, attainment, and attrition in — effective selling capacity, the gap to plan, and what it takes to close it.
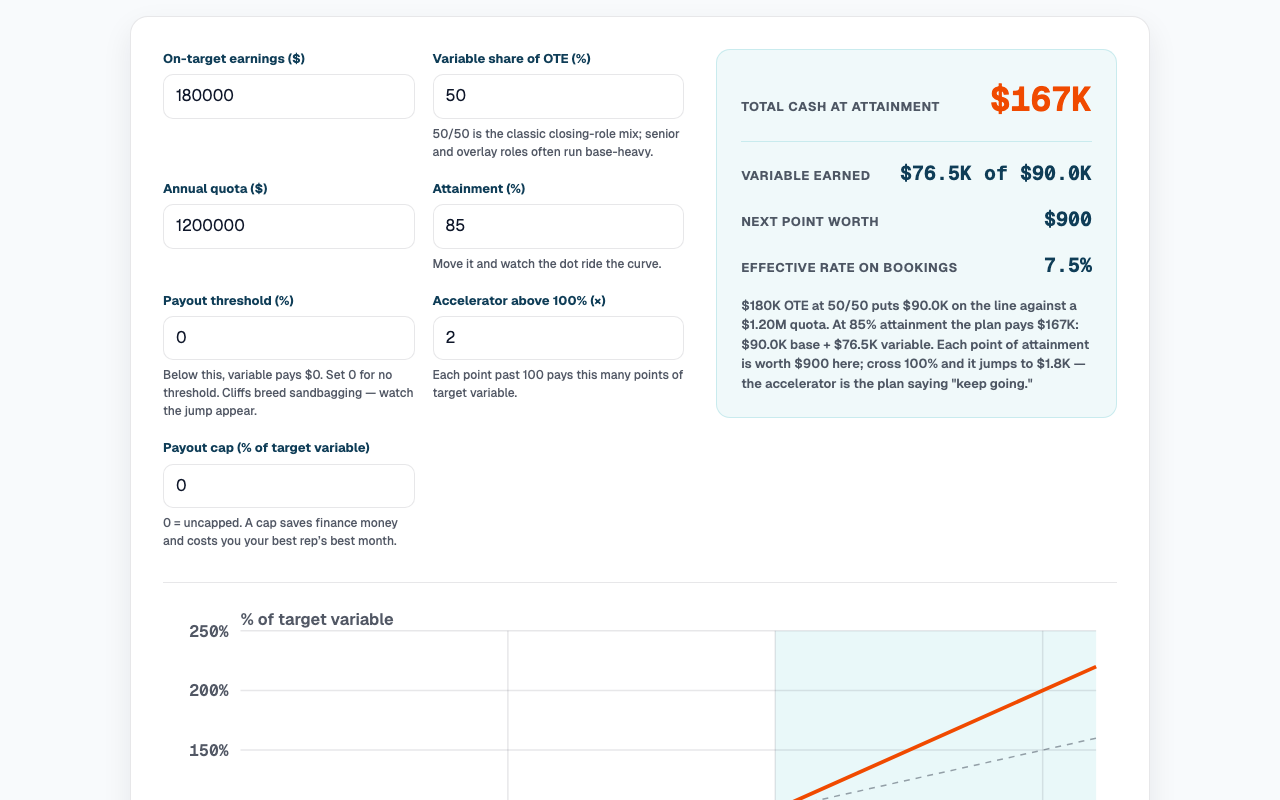
Comp Plan Payout Curve
A comp plan is a curve, not a paragraph. OTE, pay mix, threshold, accelerator, and cap in — the whole plan drawn live, with total cash at attainment and what the next point is worth.
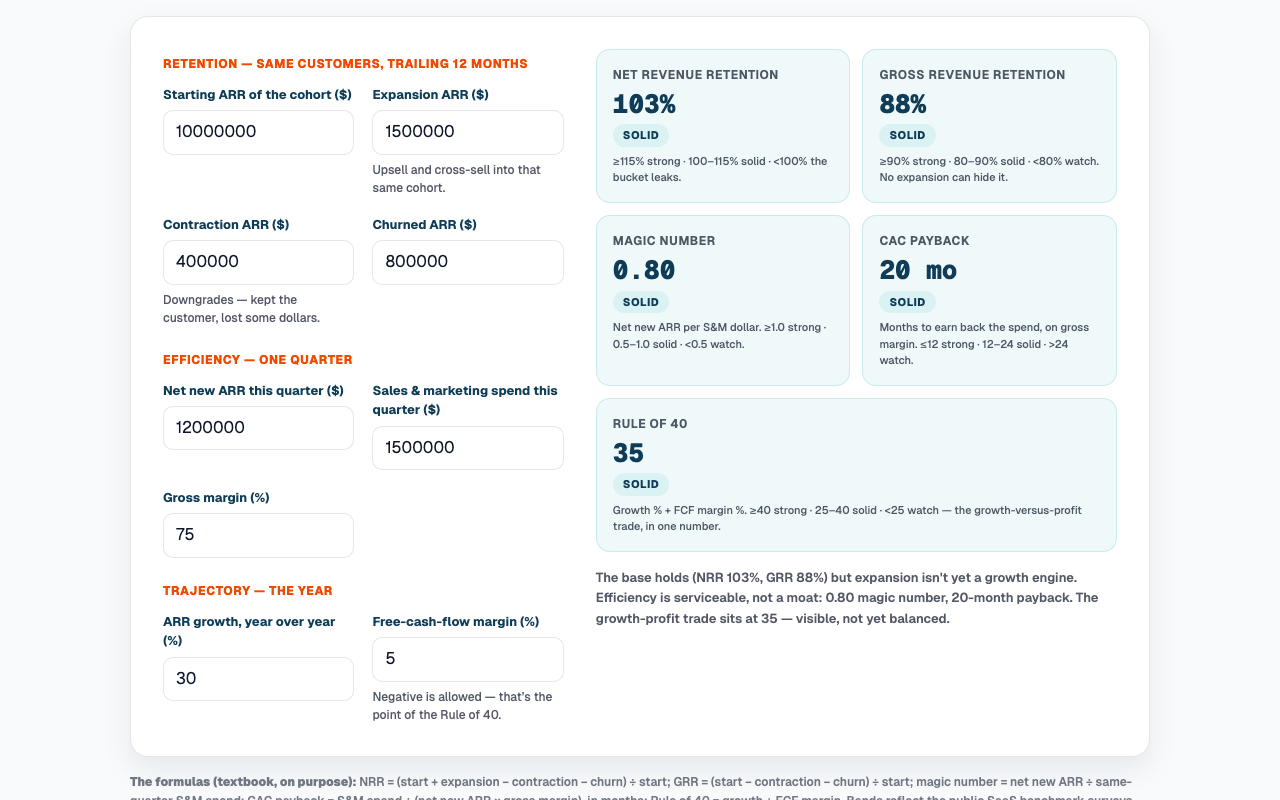
SaaS Metrics Scorecard
The five numbers a revenue leader gets asked for first — NRR, GRR, magic number, CAC payback, Rule of 40 — computed from raw inputs and scored against public benchmarks.
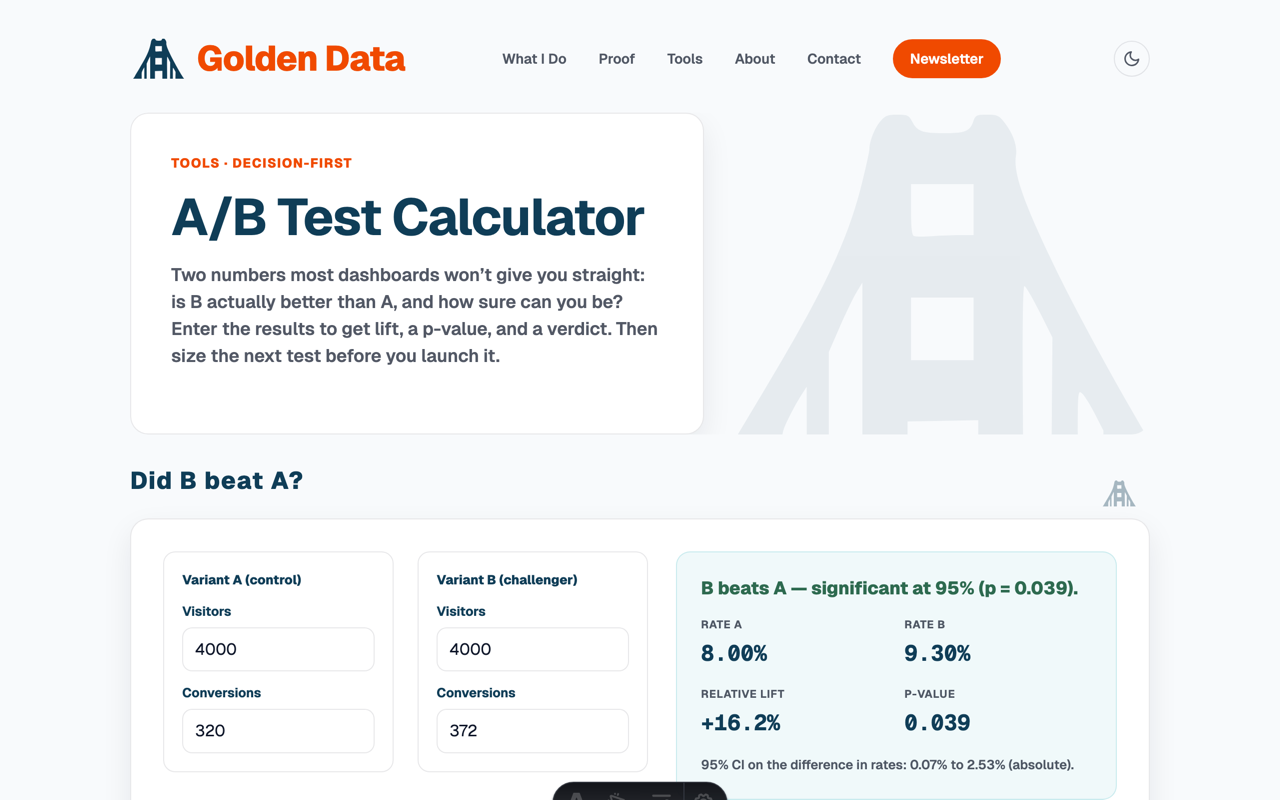
A/B Test Calculator
Drop in visitors and conversions for two variants to see lift, a p-value, and whether the result is real. Plus a planner for how many you need before you start — and, for training rollouts, a holdout sizer and a pre/post difference-in-differences reader.
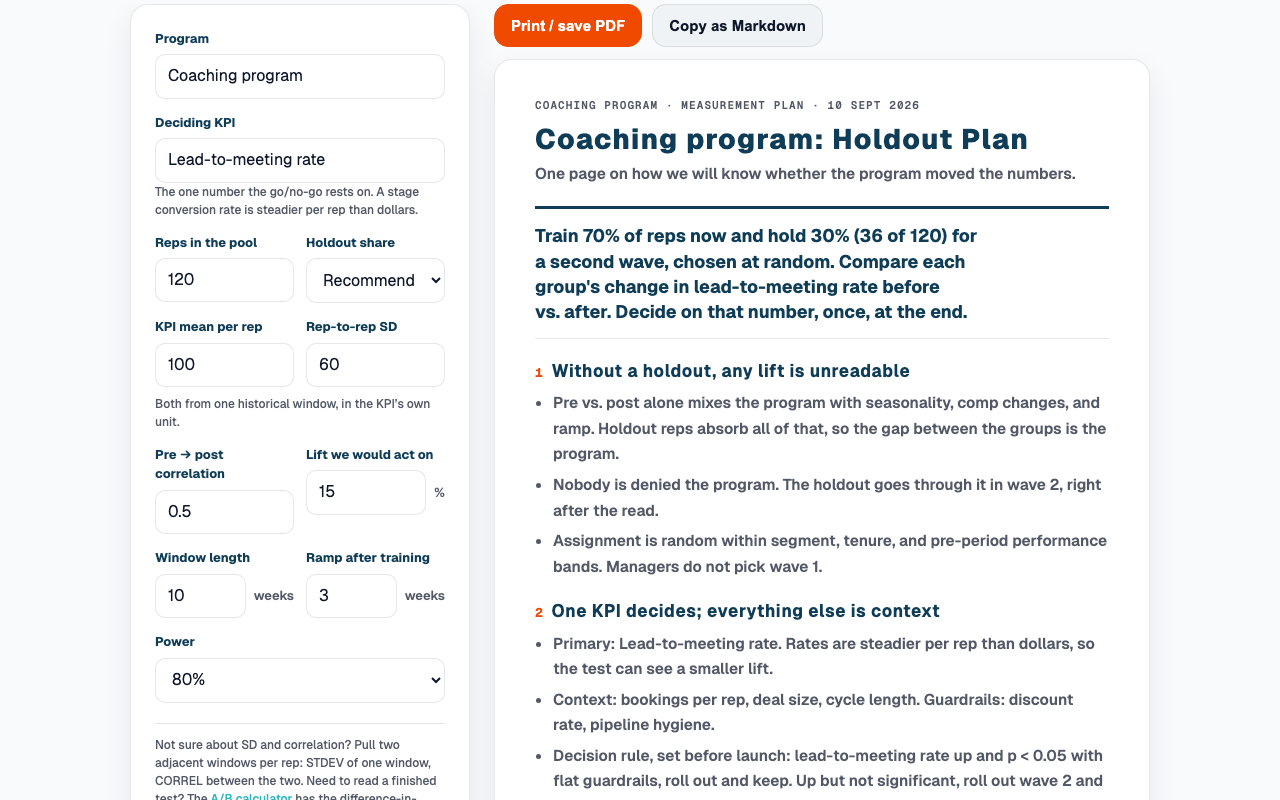
Training Holdout Planner
Turn a training rollout into a readable test. Enter the rep pool, the KPI baseline, and the lift you would act on; get the one-page plan a leadership team can sign: who waits, what decides, when we read, how big the holdout must be. Print it or copy it as Markdown.
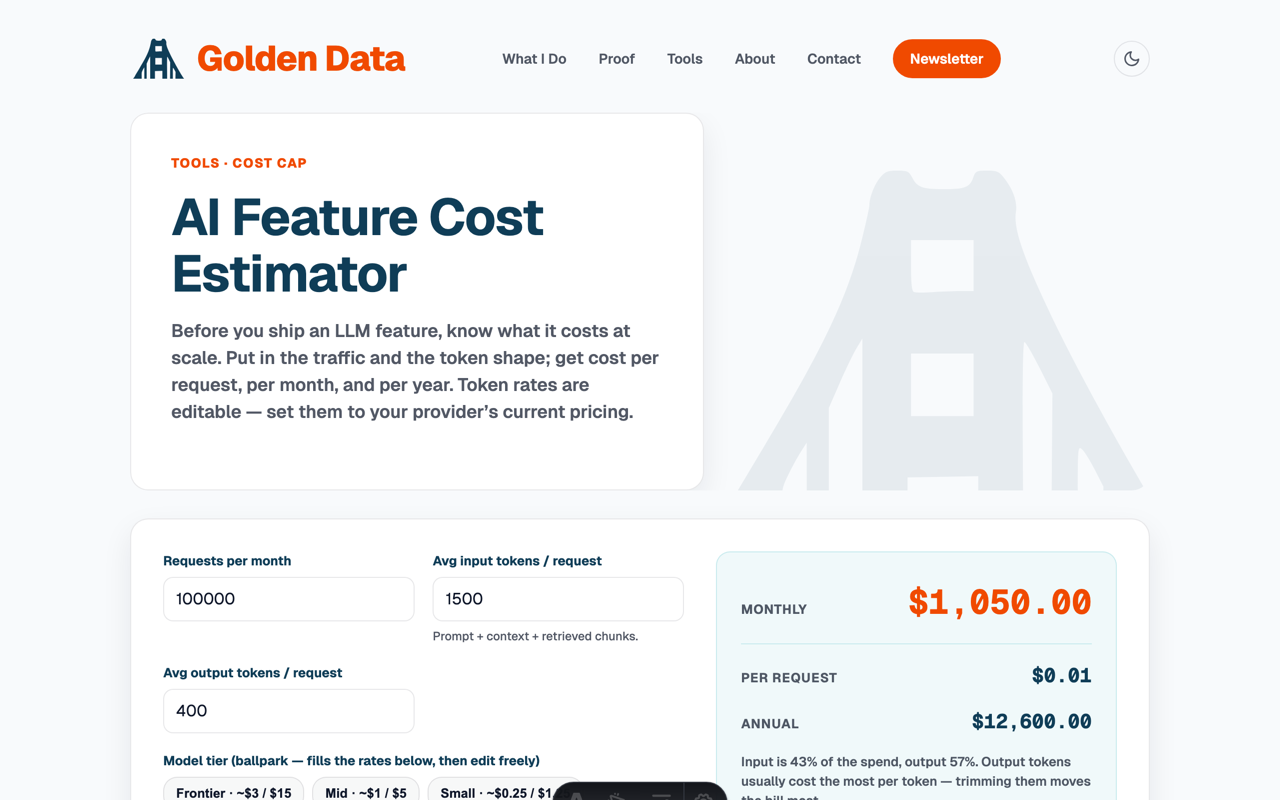
AI Feature Cost Estimator
Size the monthly bill for an LLM feature before you build it. Requests, tokens, and rates in — cost per request, monthly, and annual out.
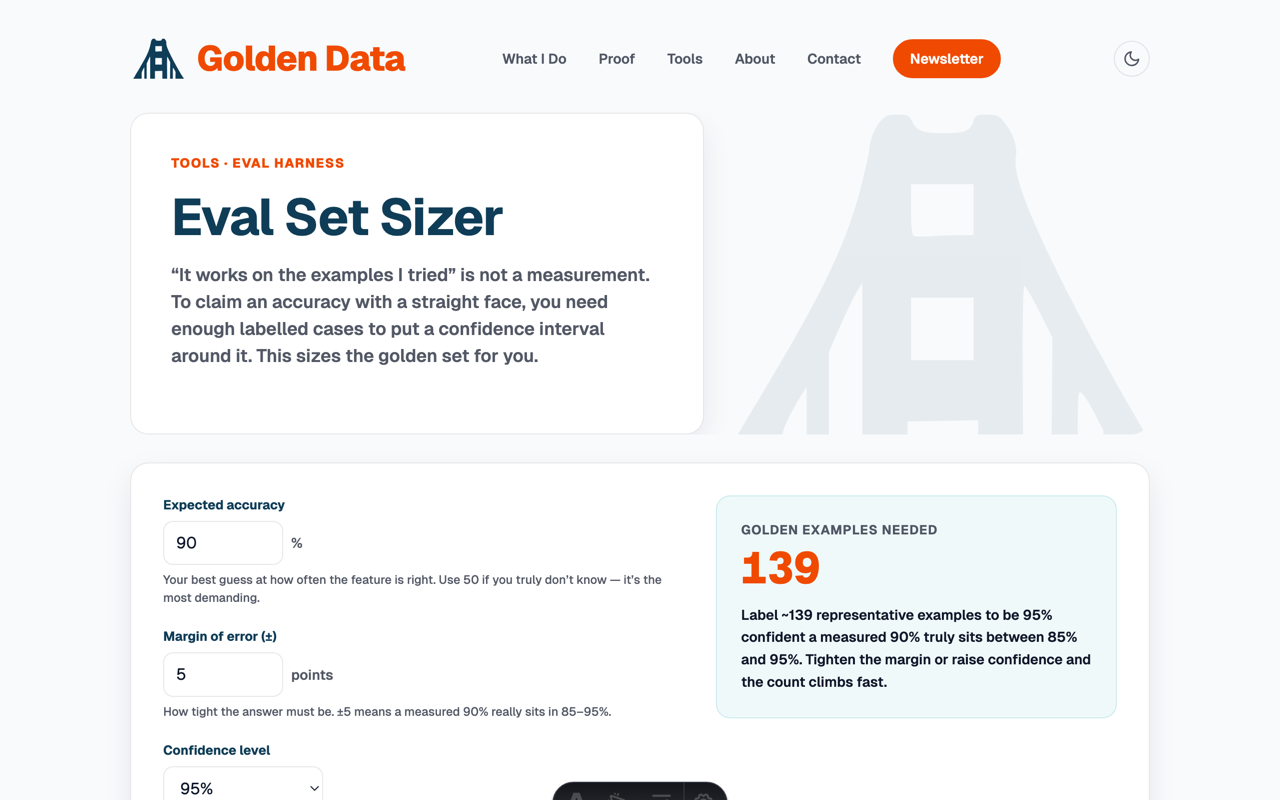
Eval Set Sizer
How many golden examples do you actually need? Pick a target accuracy, a margin of error, and a confidence level — get the sample size.
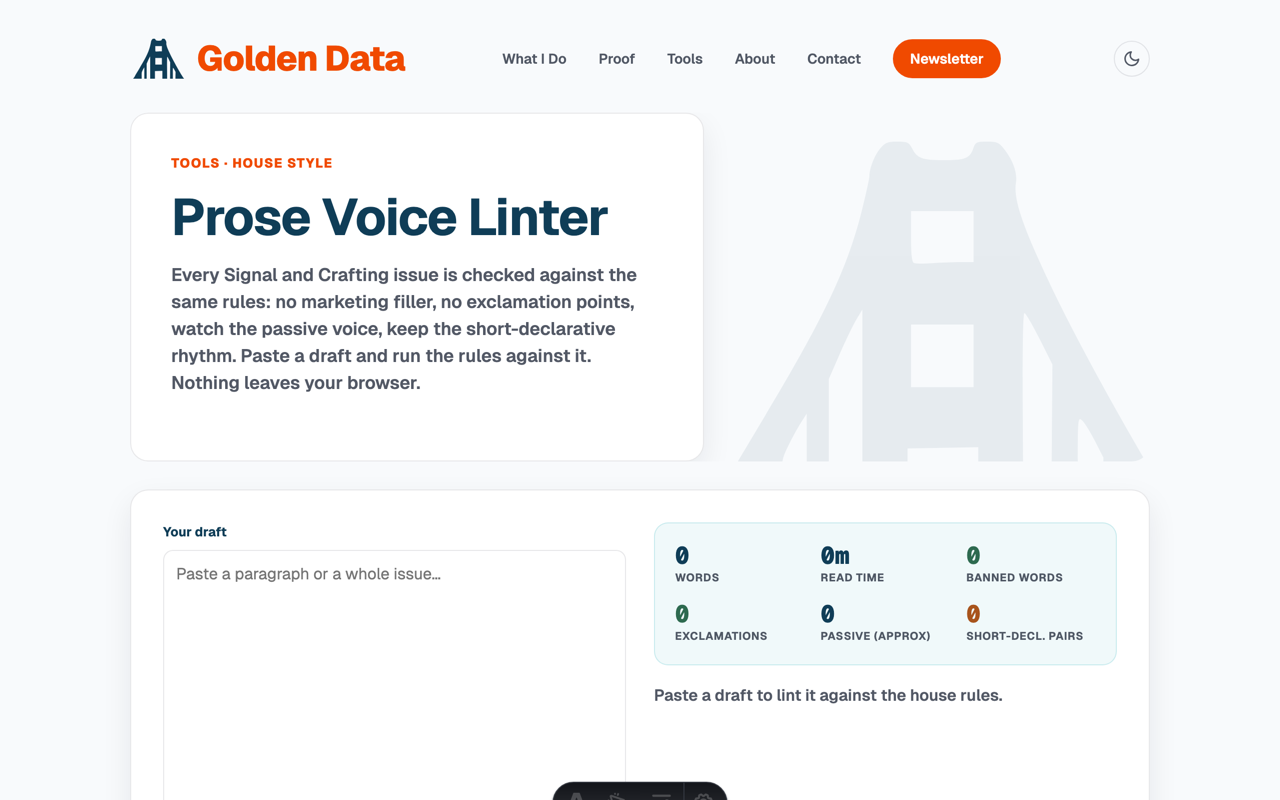
Prose Voice Linter
Paste a draft. It flags the banned words, exclamation points, and passive voice, then checks the short-declarative rhythm — the exact house rules behind Signal and Crafting.
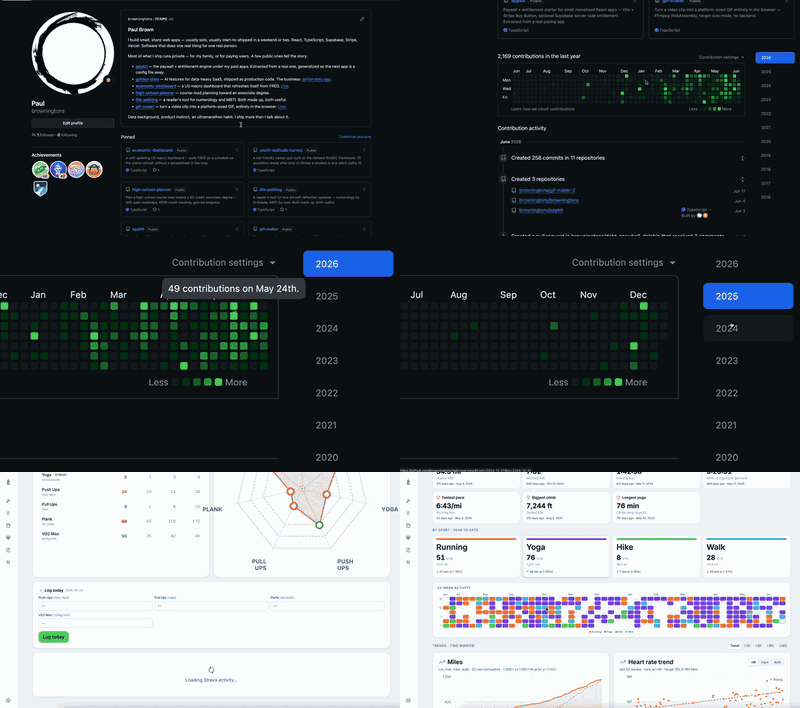
Browser GIF & Meme Maker
Panel layouts and caption templates for your own pictures, with Impact text you can drag anywhere — or turn a screen recording into a platform-sized GIF with trim, boomerang playback, filters, and client-side ffmpeg. Nothing is uploaded.
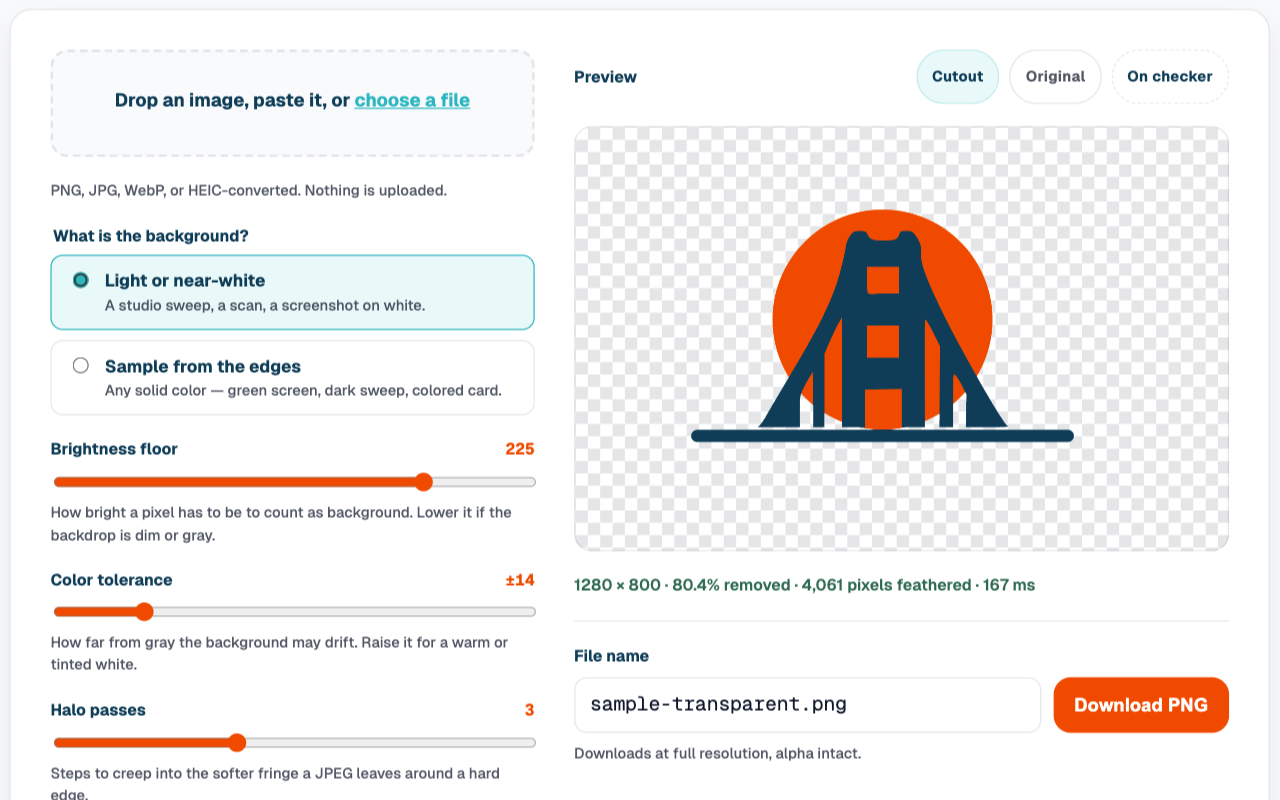
Background Remover
Drop in a photo or a screenshot, cut the backdrop out, and download a transparent PNG. It only takes background that touches an edge, so a white shirt in the middle of the frame survives. Nothing is uploaded.
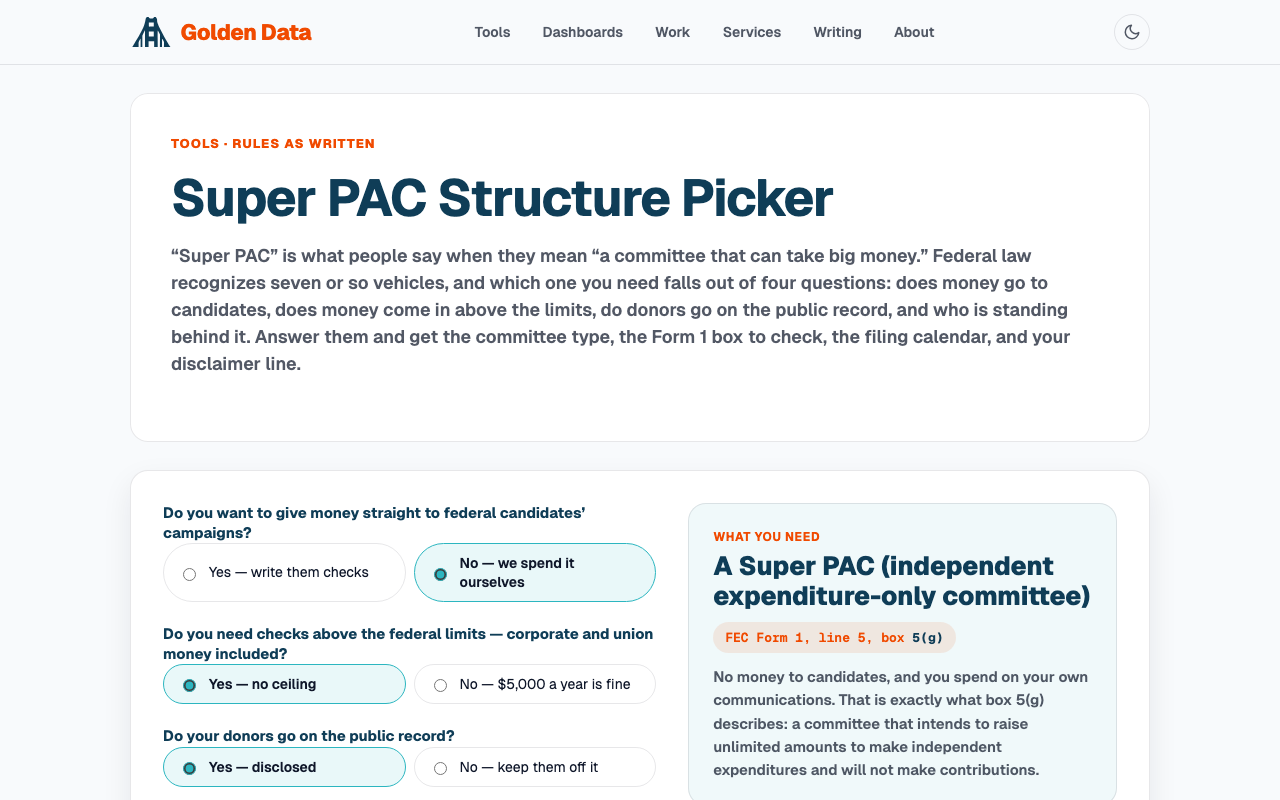
Super PAC Structure Picker
Six questions — money to candidates, money above the limits, donors public or not, who is behind it — and out comes the committee type you actually need, the FEC Form 1 box to check, the filing calendar, and your "paid for by" line.
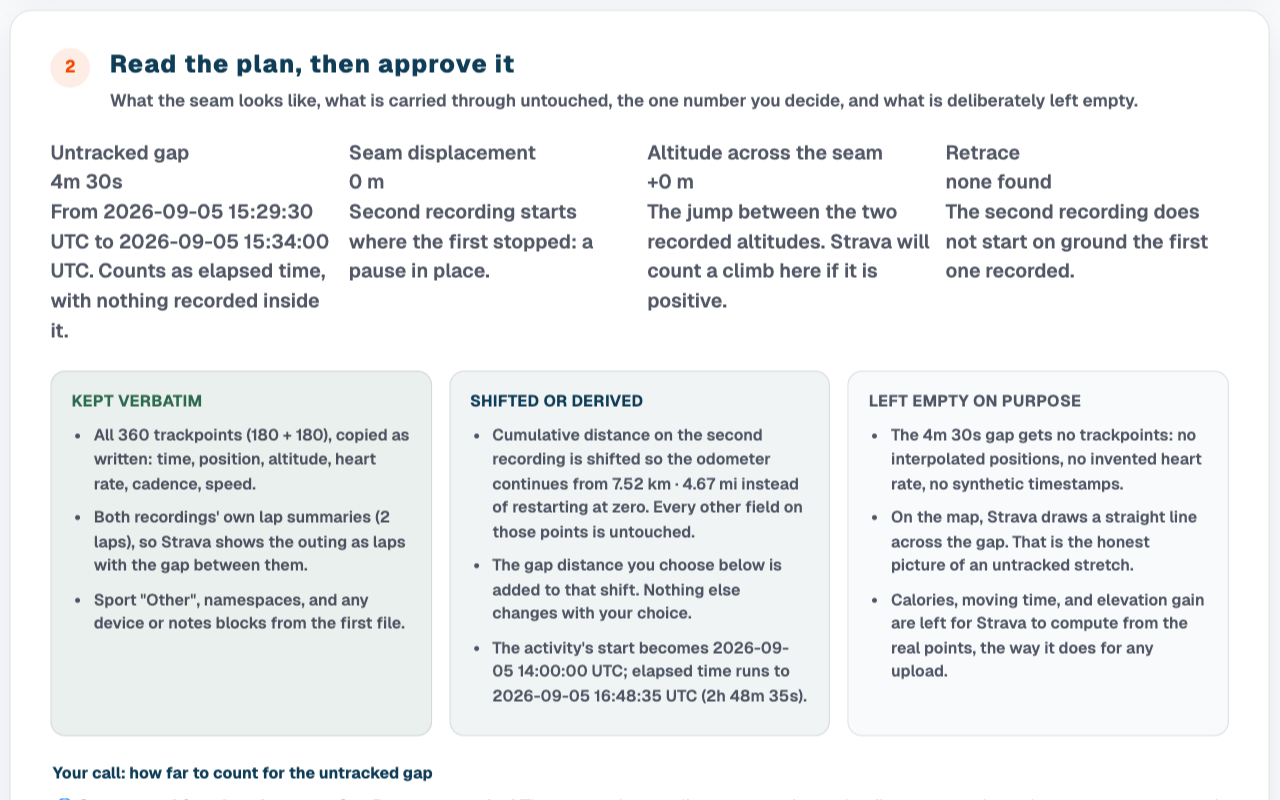
Strava Activity Stitcher
Ended the hike by accident at the turnaround and recorded the way back as a second activity? Drop both TCX exports in and get one file back with every point intact. It shows what it keeps, what it shifts, and what it leaves empty, and asks twice before it builds. Nothing is invented; nothing is uploaded.
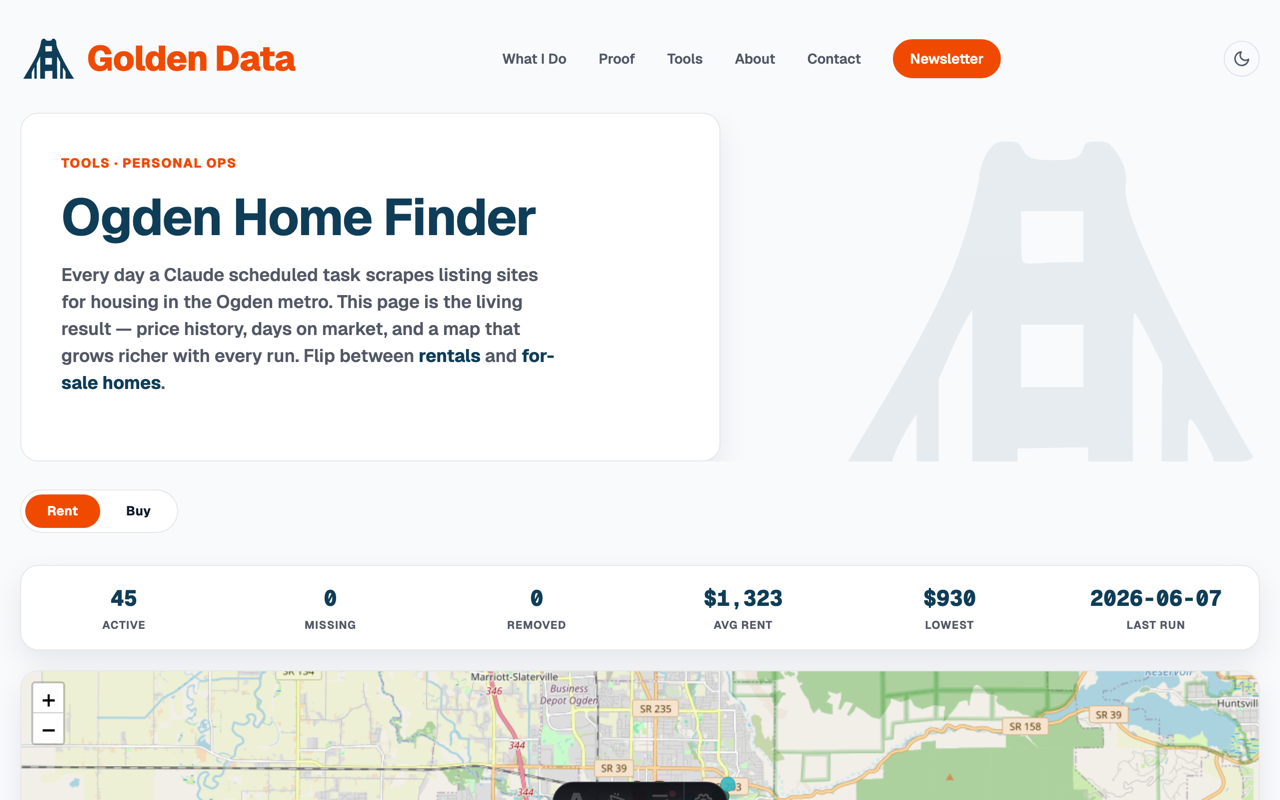
Ogden Home Finder
A living catalogue of Ogden-metro rentals and for-sale homes — tracked daily with price history, days on market and a map. An AI agent scrapes it every morning; a validation gate checks the agent’s work before anything ships.
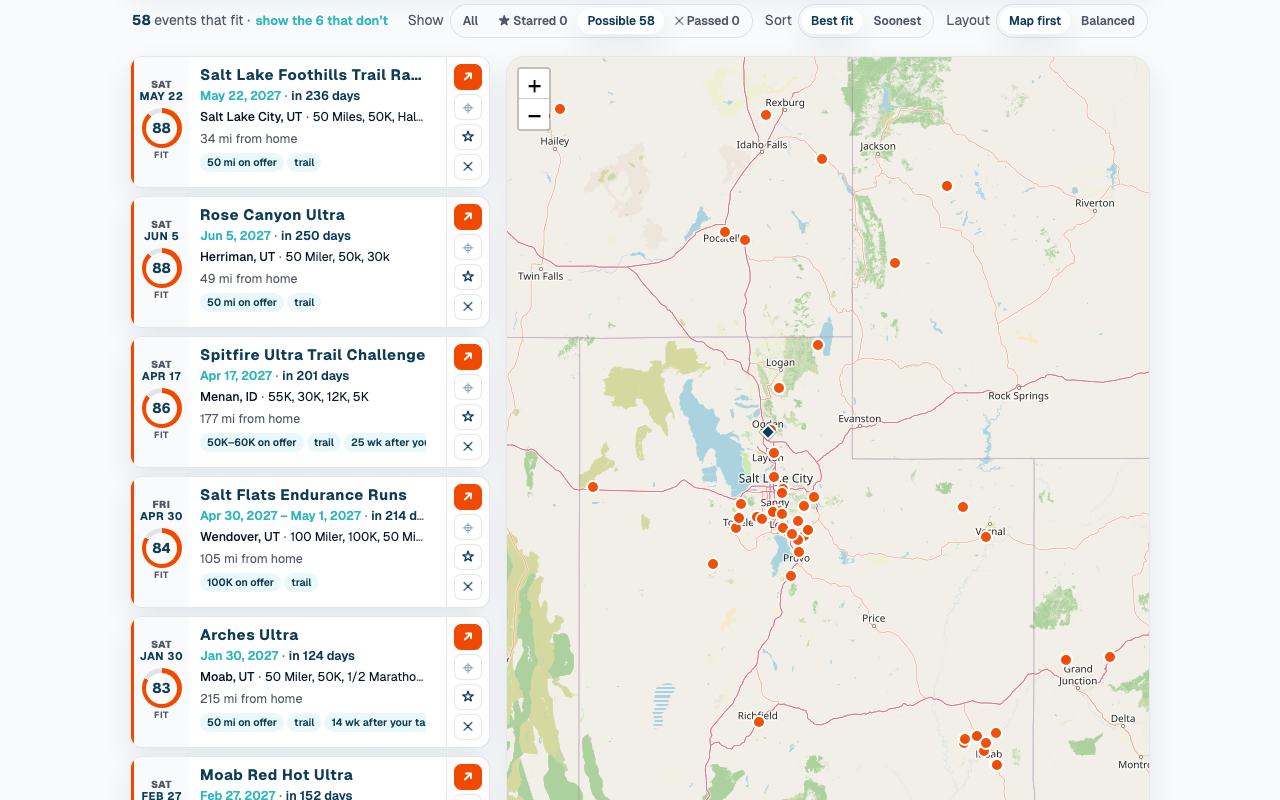
Race Finder
Every race UltraSignup lists within 250 miles of Ogden, on a map and ranked against my own profile: the distance bands around my longest race, trail over road, the months I race, recovery after my target, the drive. Every score prints its reasons. My record sits on the same map with the times from my Strava log. Star the ones worth a look; your stars and preferences stay in your browser. Refreshed daily.
The offer
A 90-day build of the pipeline, forecast, and capacity systems a revenue team runs on, on your data. Then a monthly bench that keeps them current. Priced on the page.
Golden Data / Dashboards
Field notes, in the open
Questions chased for their own sake — happiness, economics, mobility. Years of Tableau work ported into interactive charts that live natively on the site. Reskinned to the house style, not embedded in an iframe.
Pick a field note
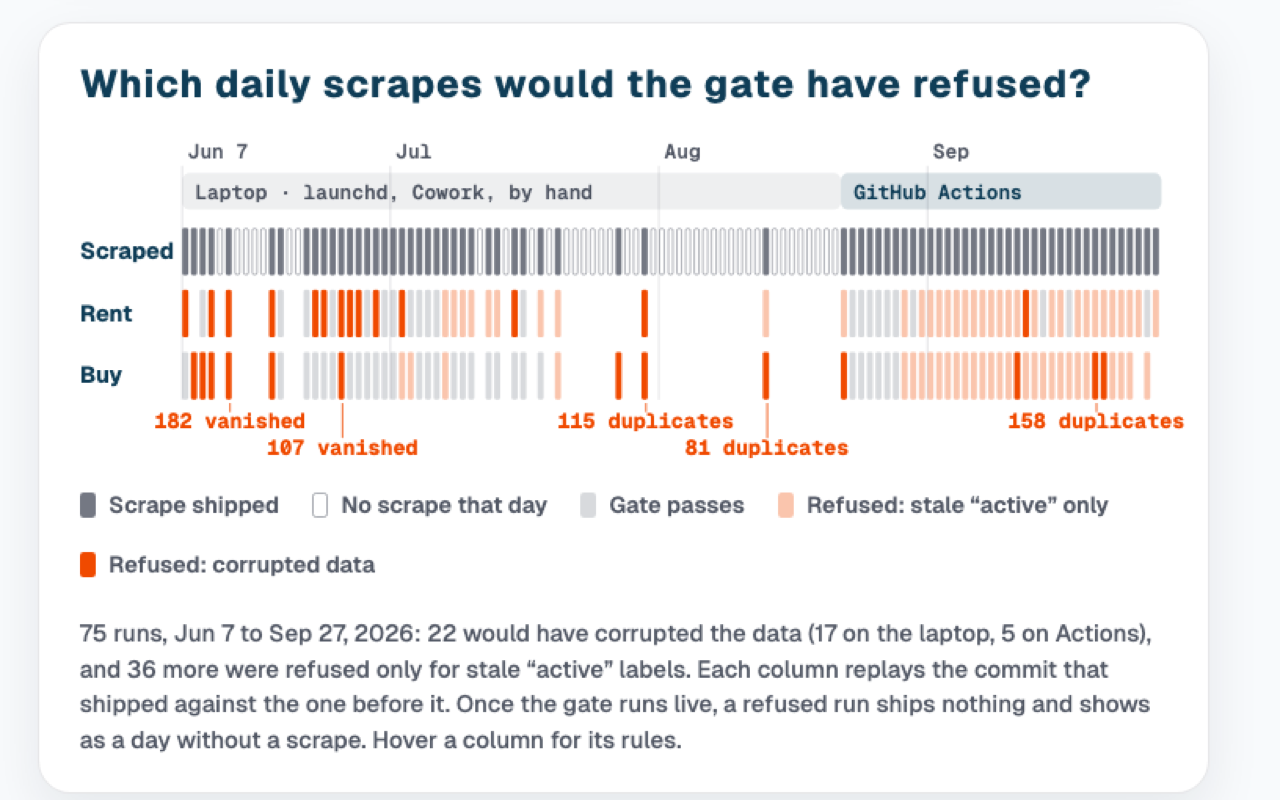
The Scrape Gate
An AI agent scrapes Ogden housing every morning and commits it to this site with no one reviewing it. The model only reads; code owns the keys and the history; a gate refuses any run that looks like corruption rather than a market move. Every scrape since June replayed through the gate: the move to an always-on runner stopped the missed days, but not the bad runs, like the one that added 158 duplicate homes overnight. The replay also caught a quiet one: “active” had stopped meaning on the market, with more than half the homes unseen for a week. The backlog the gate can’t fix is on the page too.
Below Replacement, Even in Utah
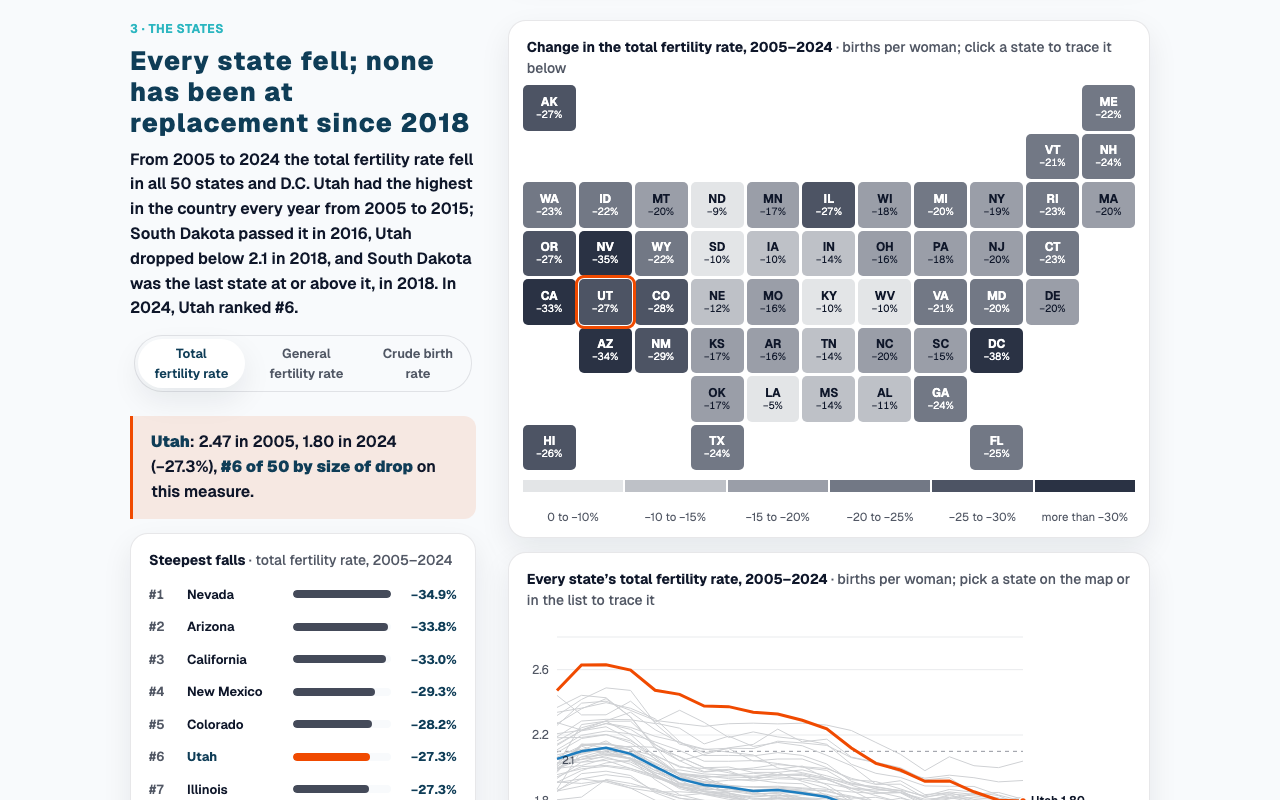
The world’s fertility rate has more than halved since 1963, and two in three people now live in a country below replacement; the U.S. hit a record low of 1.60 in 2024. Utah had the highest rate of any state every year from 2005 to 2015, fell below 2.1 in 2018, and from any start year 2010–2016 has fallen further than any other state. Every state 2005–2024 from NCHS final data, “Utah fell furthest” checked measure by measure, and six explanations tested against all fifty states: later marriage fits best.
Four Thousand Weeks
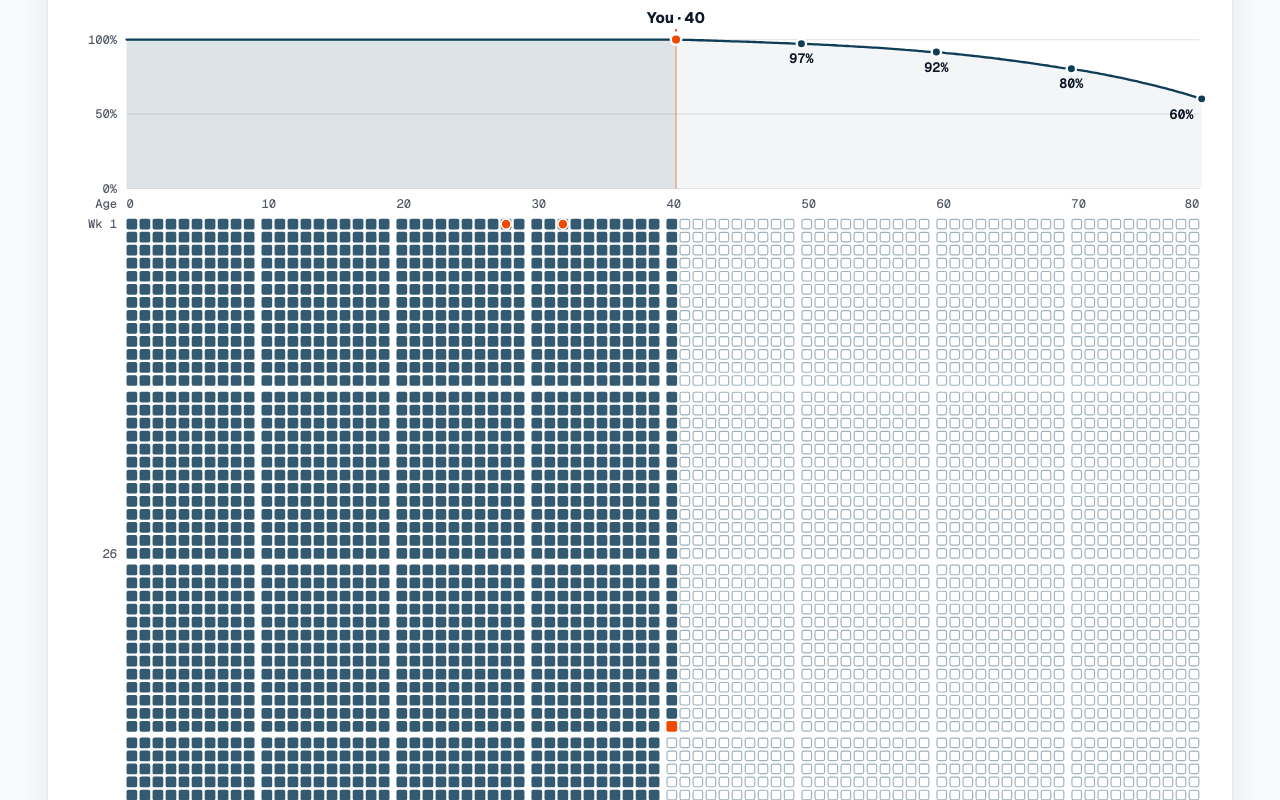
Burkeman’s four thousand weeks as a grid you can put your own birthday into: every week you’ve lived filled in, every week ahead an outline, with the SSA’s odds you’ll reach each age on top. Then who gets the rest, from the American Time Use Survey: more time alone, about as much with a partner, coworkers and kids falling away. Add your kids and it does the tail-end arithmetic from 145,000 raw diaries: nearly half of a parent’s at-home hours with a child are gone by the seventh birthday.
50 Years of LDS Growth: Record Counts, Not Record Growth
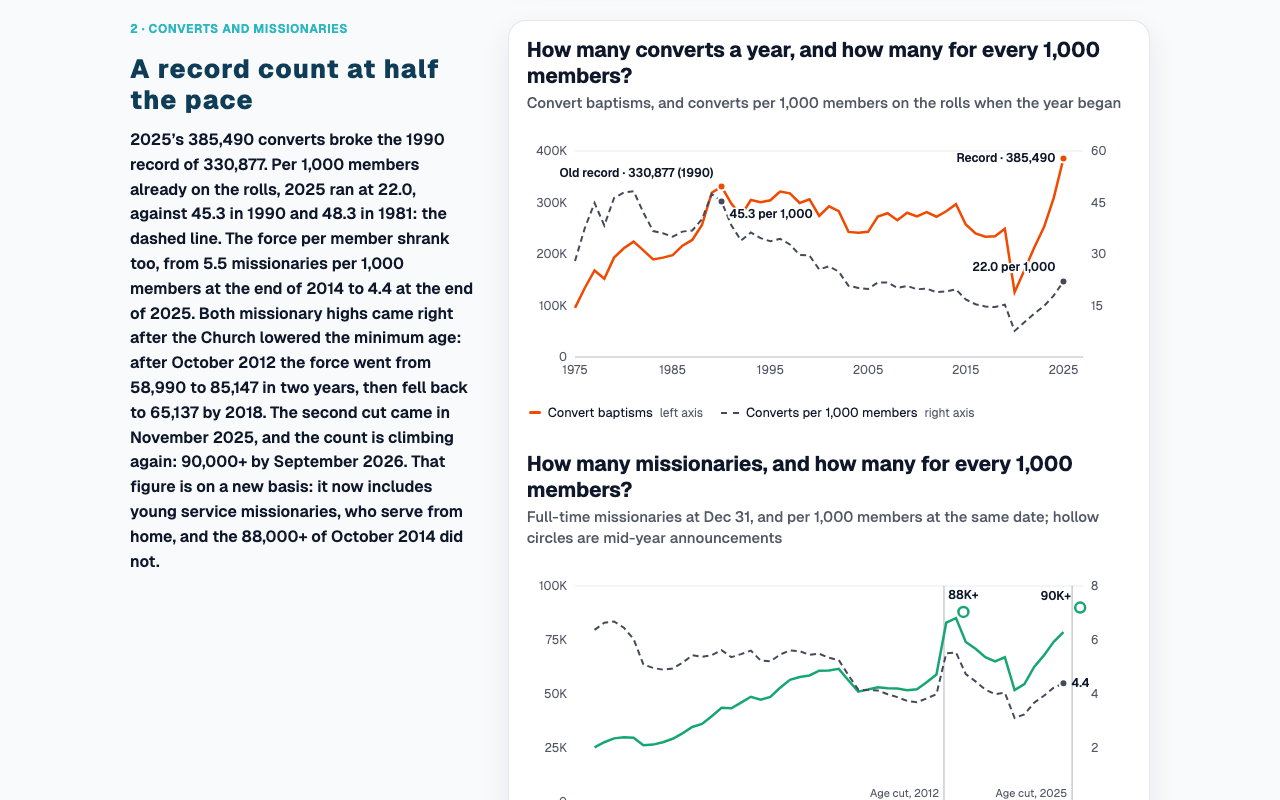
The Church of Jesus Christ of Latter-day Saints set real records in 2025–26: 385,490 convert baptisms and 90,000+ missionaries. This rebuild of my Tableau viz concedes every count, then sets each one beside its per-member rate: 22 converts per 1,000 members against 45 in 1990, a U.S. count that fell by 186 in 2025 while the rest of the world grew, and Pew’s U.S. retention down from 70% to 54%. Plus fifty years of growth decade by decade (five times the members, slower every decade), a heads-vs-hours missionary model and a claims-vs-numbers table.
Past Thirteen Miles
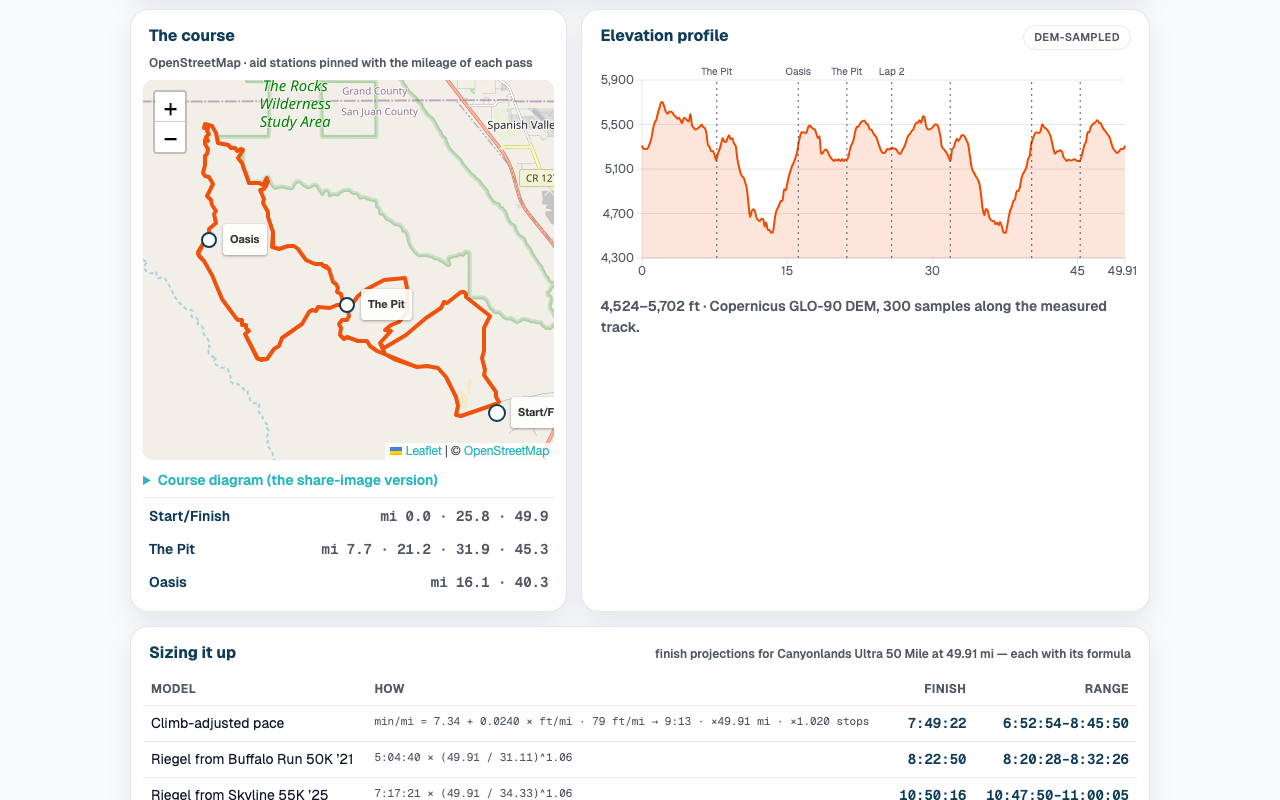
Every run of half-marathon distance or longer I have logged since 2020, fed live from my Strava table through an anonymized view — then the official ultras reviewed one by one: the Buffalo Run 50K, two editions of the Skyline 55K a year apart, and the Canyonlands 50 Mile course — the target for October 24, not a bib yet — sized up against my own numbers.
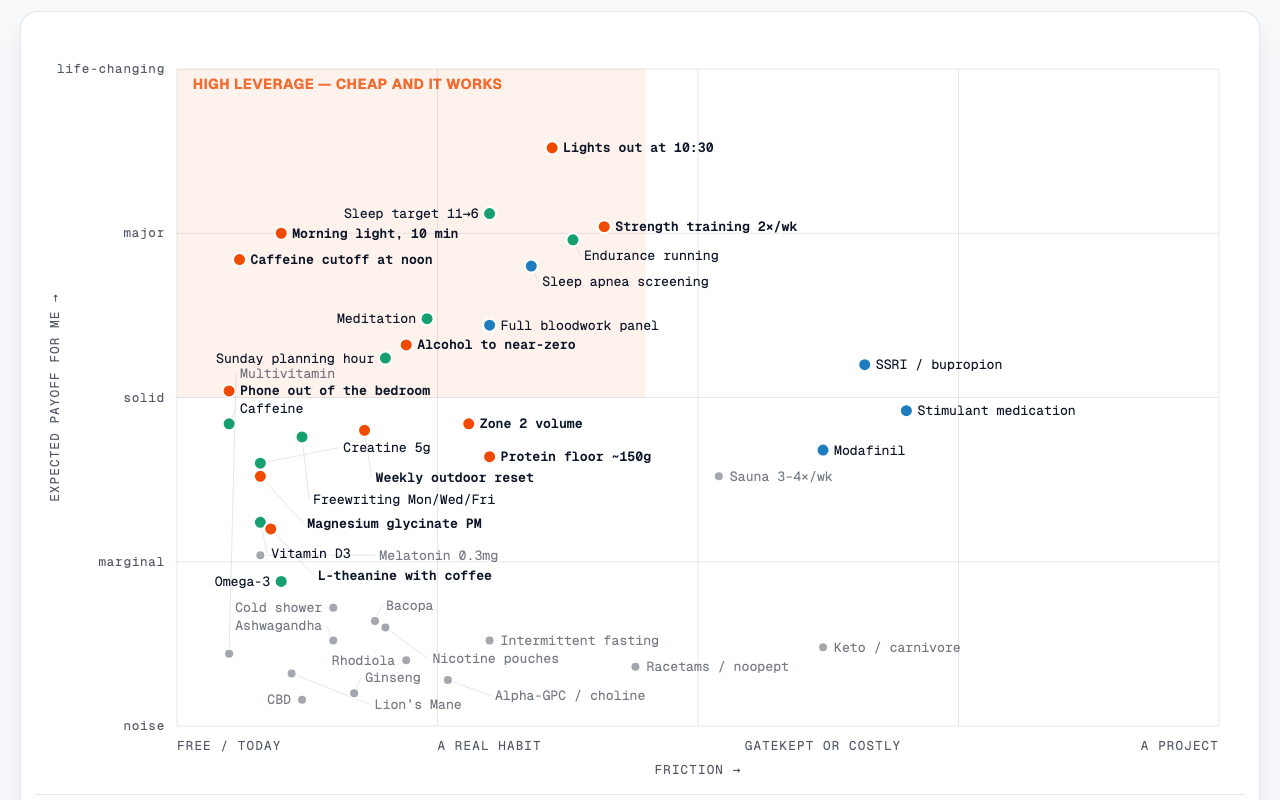
Leverage Map
Personal interventions plotted by friction vs. payoff — what I already do, what’s next, what’s noise.
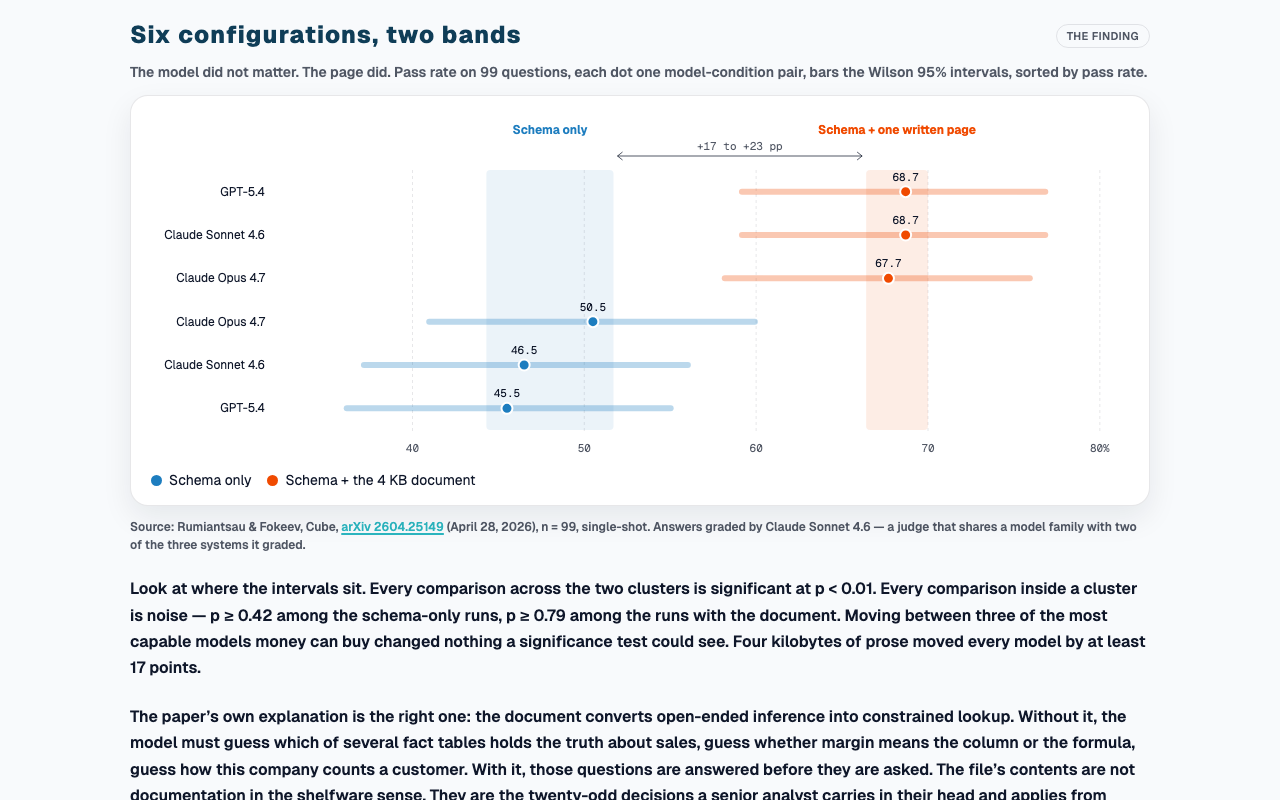
The Page Was Worth Twenty Points
A 4 KB hand-written markdown file describing what a retail dataset means was worth 17 to 23 points of text-to-SQL accuracy to three frontier models — and switching between the models was worth nothing. Cube’s 99-question benchmark, the literature band behind it, what the page cost in tokens, and what survives when a semantic model migrates. The page, not the model, was the lever — and that page is an SOP.
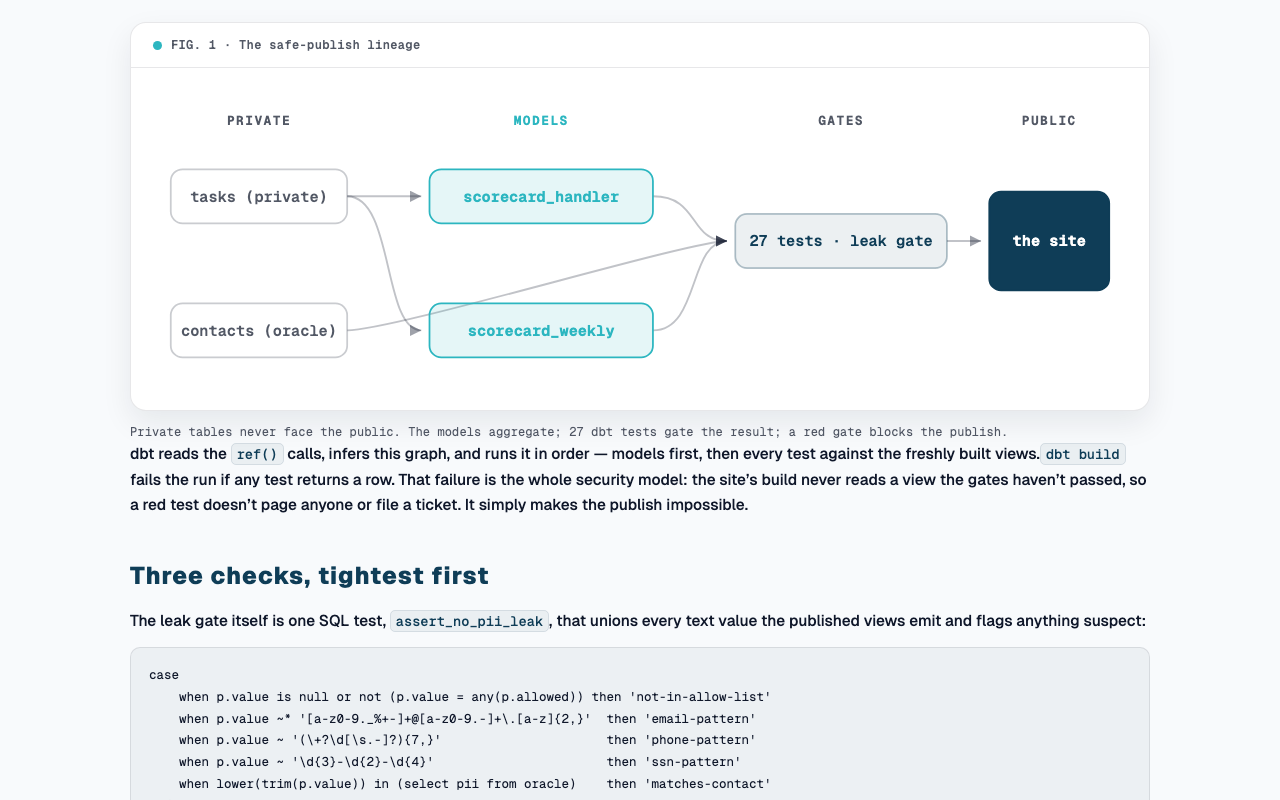
The Leak Gate
The agent-vs-human scorecard reads my real task manager — titles, notes, and people attached — and publishes none of it. The anatomy of the dbt layer in between: allow-list models that emit only aggregates, a leak gate with an oracle built from the private contacts table, and the week a mutable timestamp restamped 90 days of history into two buckets without failing a single test. The incident is now a test.
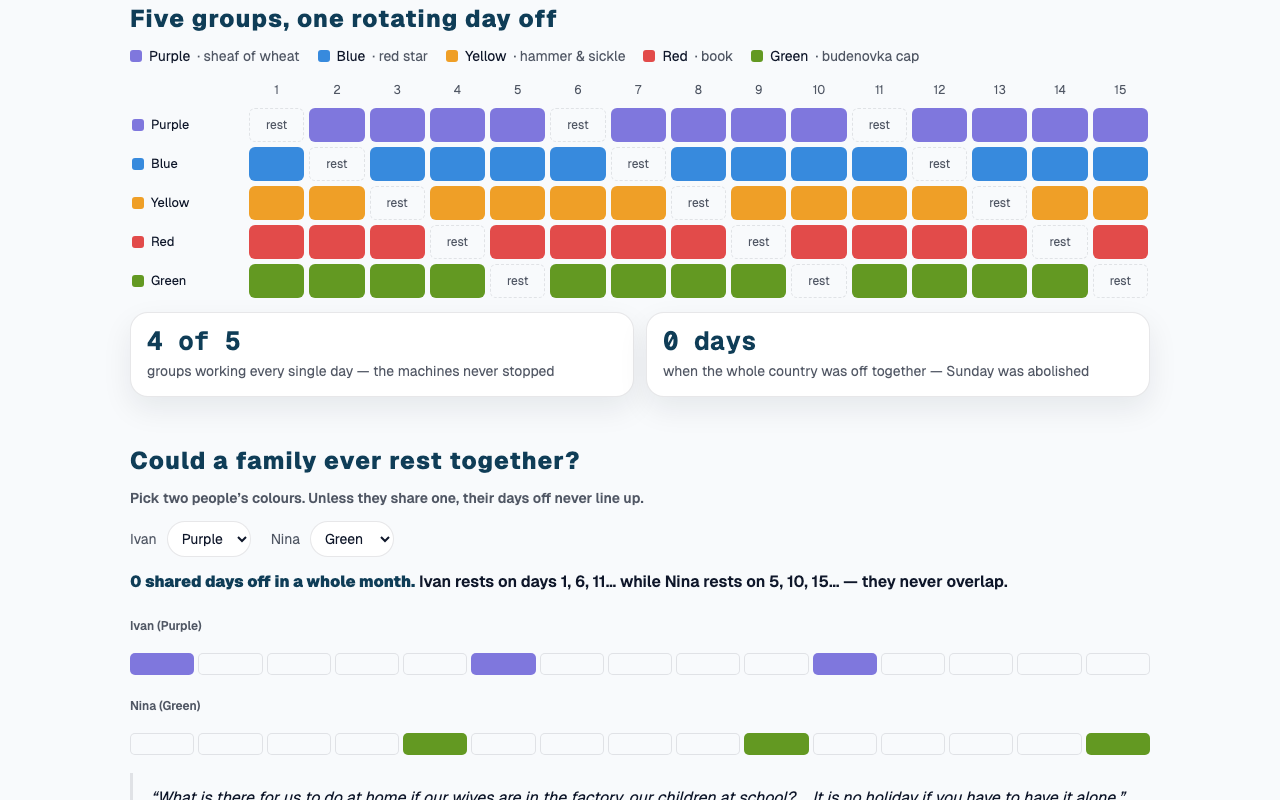
The Week That Had No Weekend
In 1929 the Soviet Union tried to abolish the weekend. The nepreryvka split the workforce into five colour groups on a rotating five-day cycle — four-fifths always working, so the factories never stopped, and no universal Sunday to anchor religious life. The staggering fractured families: pick two people’s colours and watch their days off never line up. Traces the calendar from the five-day week to the six-day shestidnevka to the seven-day week’s return in 1940 — and debunks the two myths the story usually carries.
When Sweden Vacations Together
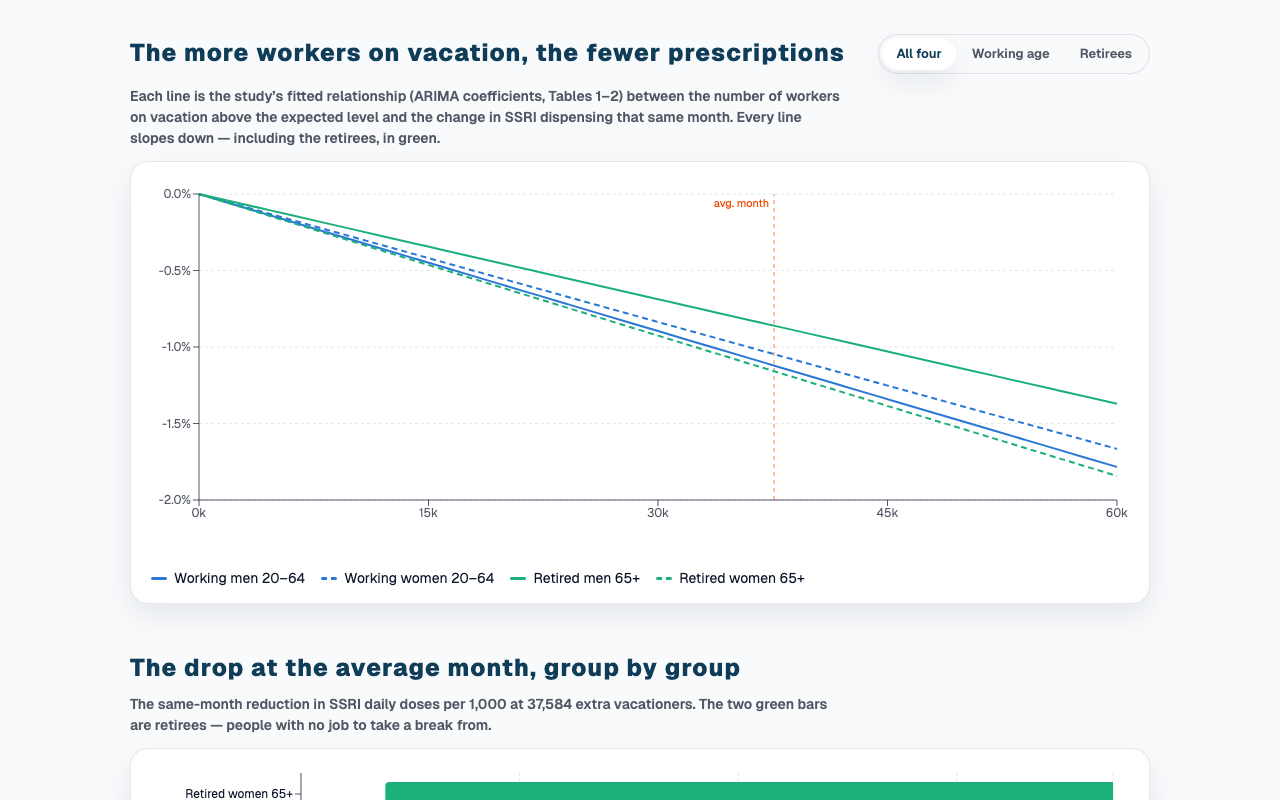
Terry Hartig tracked how many antidepressants Swedish pharmacists dispensed, month by month, for twelve years. The more workers were on vacation at the same time, the fewer prescriptions went out that month — and the effect reached retirees too, who had no job to break from. Evidence that rest is contagious. Rebuilt from the paper’s published ARIMA coefficients: an exact dose-response curve, the drop group-by-group, and a reconstruction of the raw seasonal series.
The Agent-vs-Human Scorecard
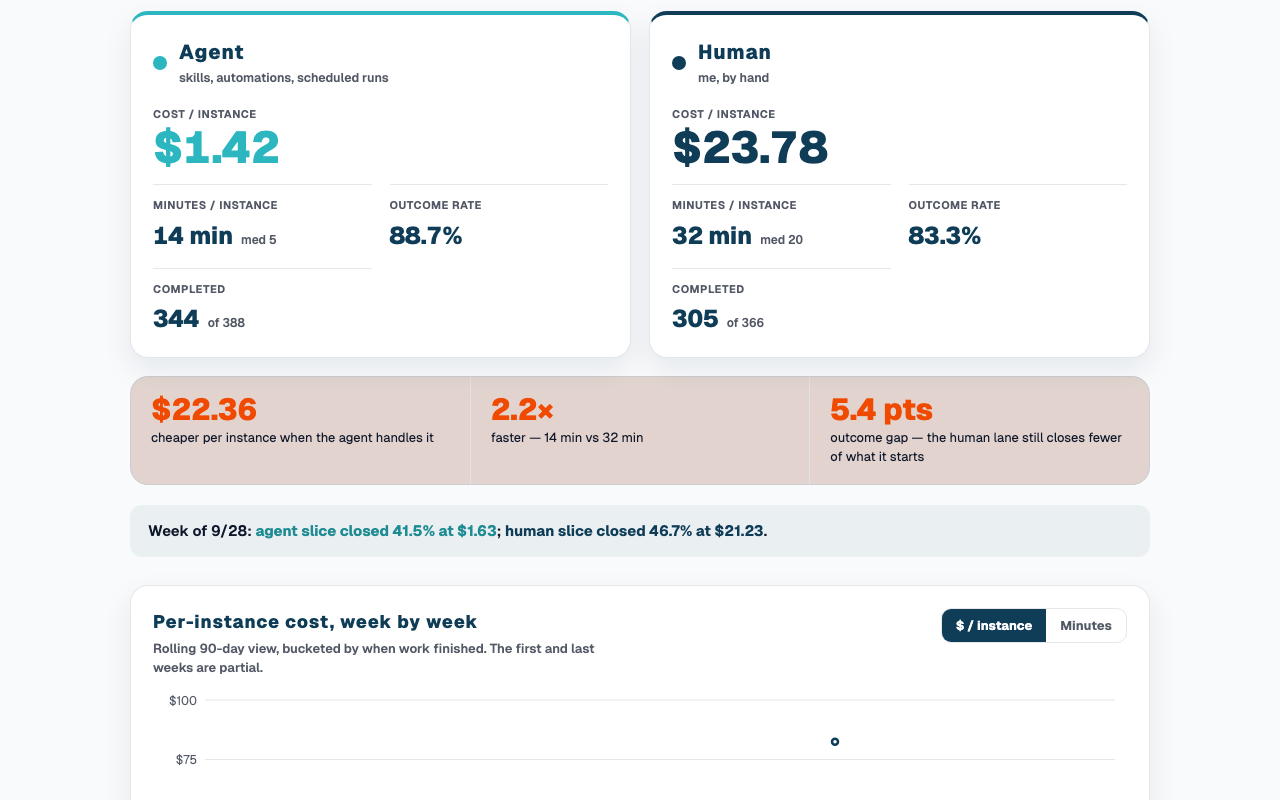
The workbench measured on itself over a rolling 90-day window. Every task is tagged with who did it — agent or human — and this is the two-column readout of that split: outcome rate, dollars per instance, and minutes to complete. Fed live at build time from anonymized database views (see the dbt leak gate) that never expose a task title, note, or category.
Productivity Has Left Wages in the Dust
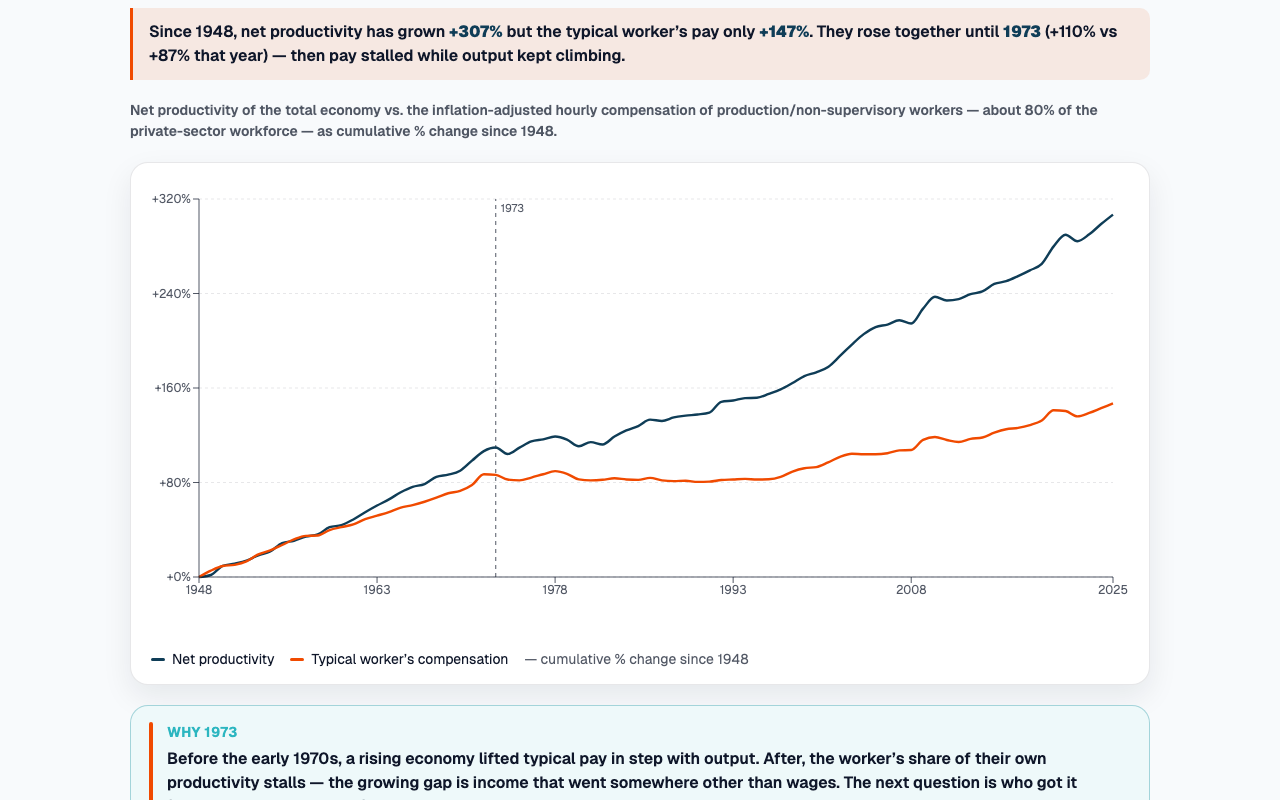
For a generation the typical worker’s pay rose right alongside what they produced. Around 1973 the lines split — net productivity is up +298% since 1948, worker pay only +143% — and the wedge between them is income workers generated but didn’t take home. The setup for the obvious next question: will the AI productivity surge flow back to pay, or repeat the pattern? Fed by EPI’s State of Working America data.
How Far CEO Pay Pulled Away
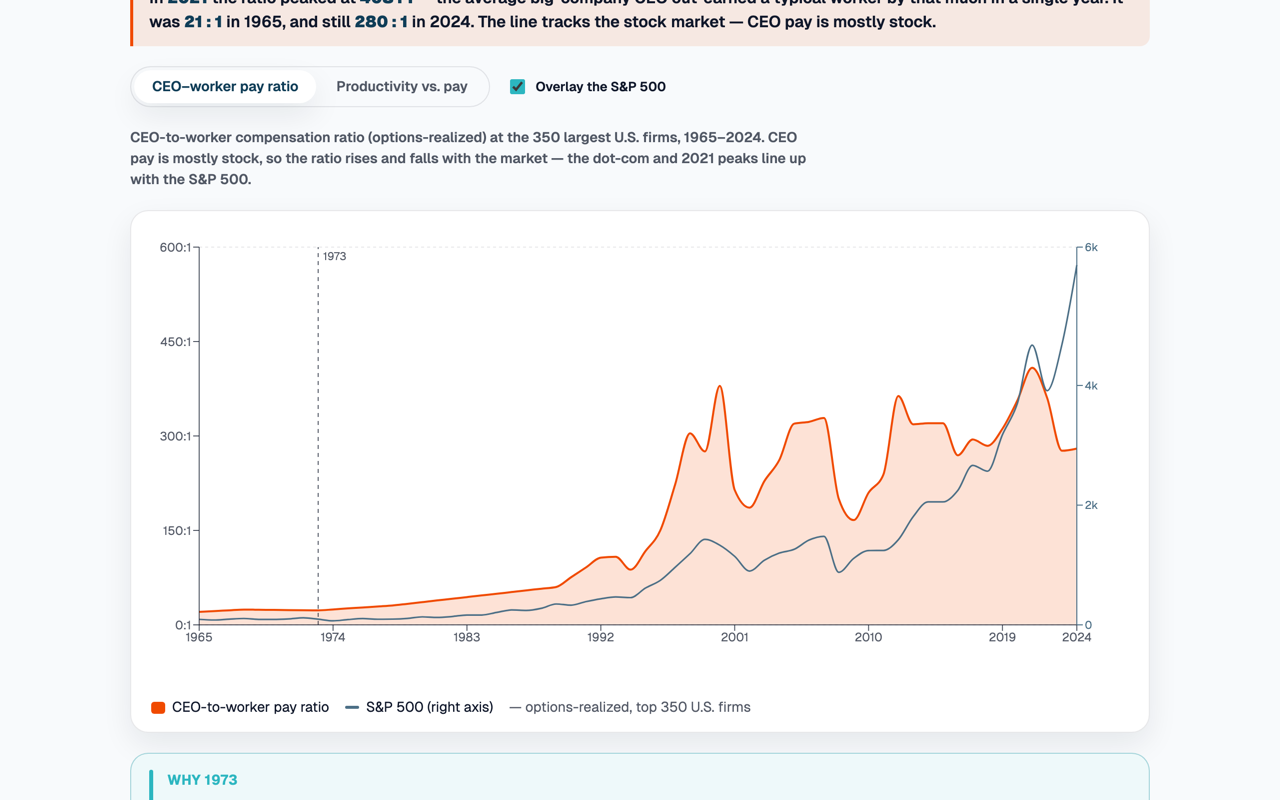
In 1965 a big-company CEO made about 21 times a typical worker; the ratio peaked at 408:1 in 2021 and sits at 280:1 today. Because executive pay is mostly stock, the line swings with the market — toggle the S&P 500 overlay to see it track. The options-realized measure for the 350 largest U.S. firms, fed by EPI’s State of Working America data — then search a company you know for its own ratio, straight from its SEC proxy.
Nuclear Weapon Inventory
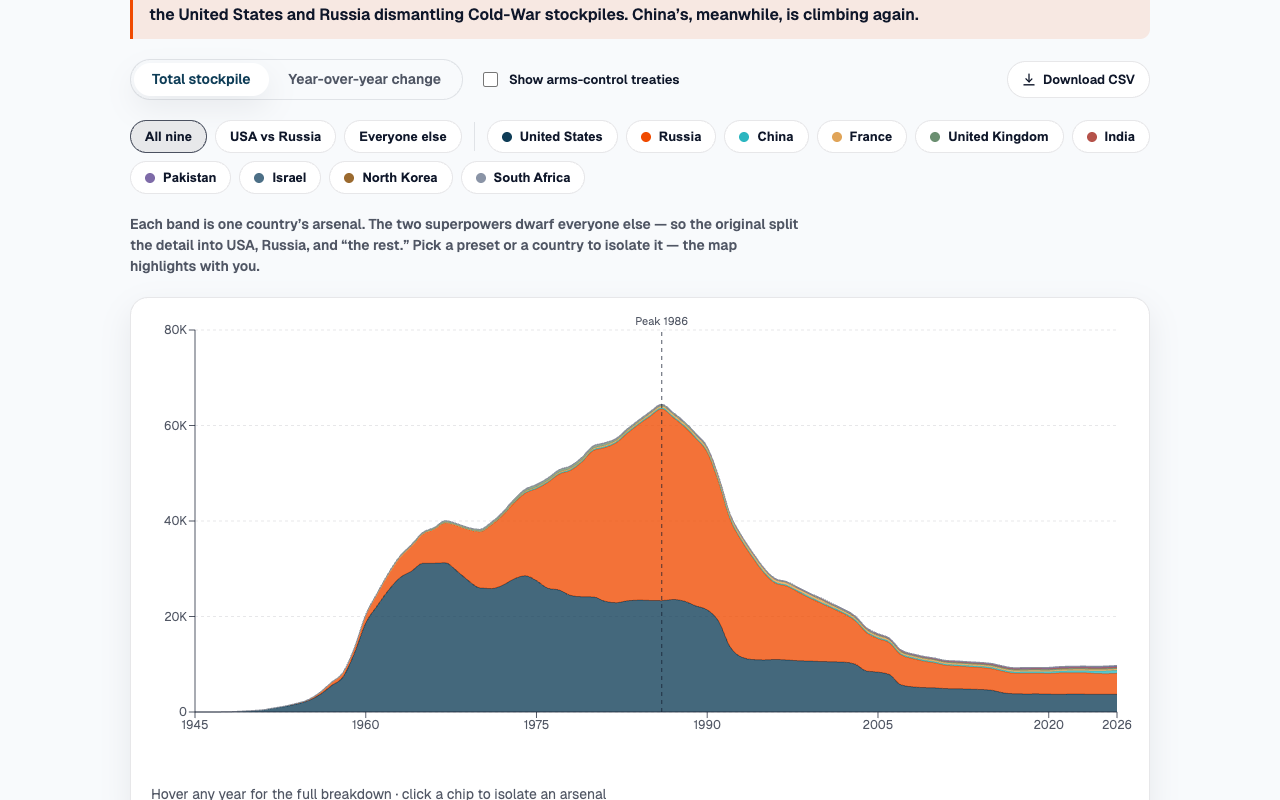
Every nuclear warhead on Earth, year by year since 1945. The stockpile peaked at 64,452 in 1986 and has fallen 85% since — almost all of it the US and Russia dismantling Cold-War arsenals. Flip between total stockpile and the year-over-year buildup/teardown, overlay the arms-control treaties, and isolate any of the nine arsenals on a linked world map. Fed by an FAS/Our World in Data feed that refreshes year to year.
Topology of Music
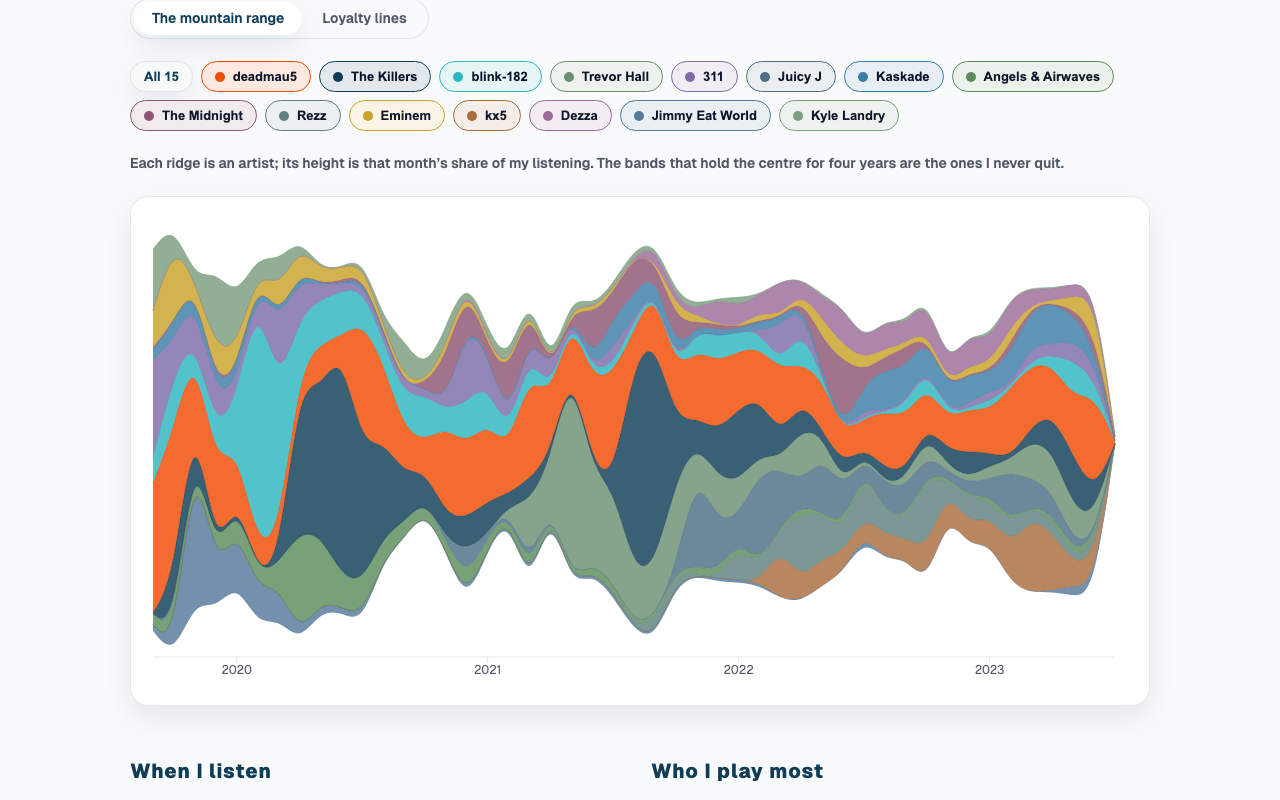
Every song I’ve logged since 2019, rebuilt from Tableau as a “mountain range” of my top-15 artists. Not just who I played most, but who I stayed loyal to — each artist climbs for every return inside four days and dips when I let them lapse. deadmau5 never stops climbing.
Mormon Pioneer Trek to the Salt Lake Valley
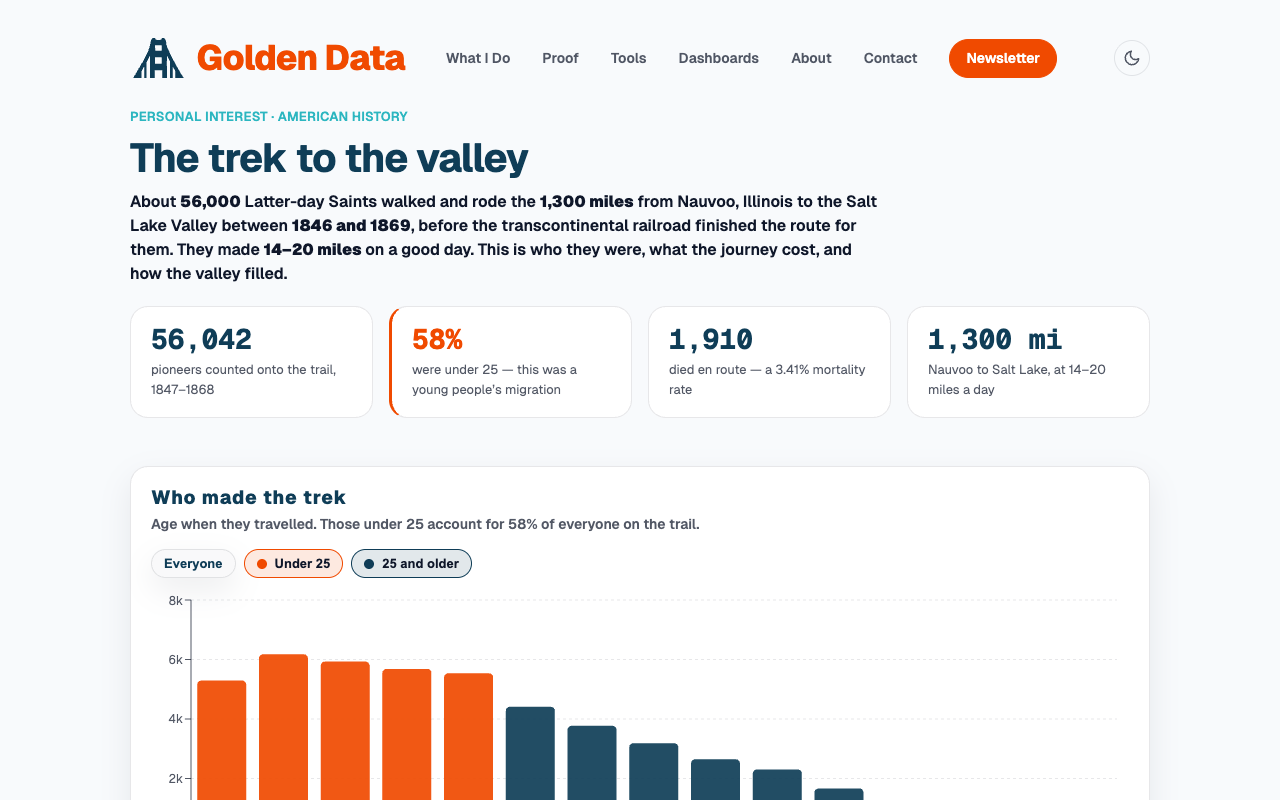
The 56,000 Latter-day Saints who walked 1,300 miles to the Salt Lake Valley, rebuilt from Tableau as one themed dashboard. A young people’s migration (58% under 25), cholera as the trail’s defining killer, a U-shaped mortality curve — and the Company Type filter made real: pick Willie & Martin to watch mortality jump to 16.5%.
Faith and Human Evolution: Mental Gymnastics
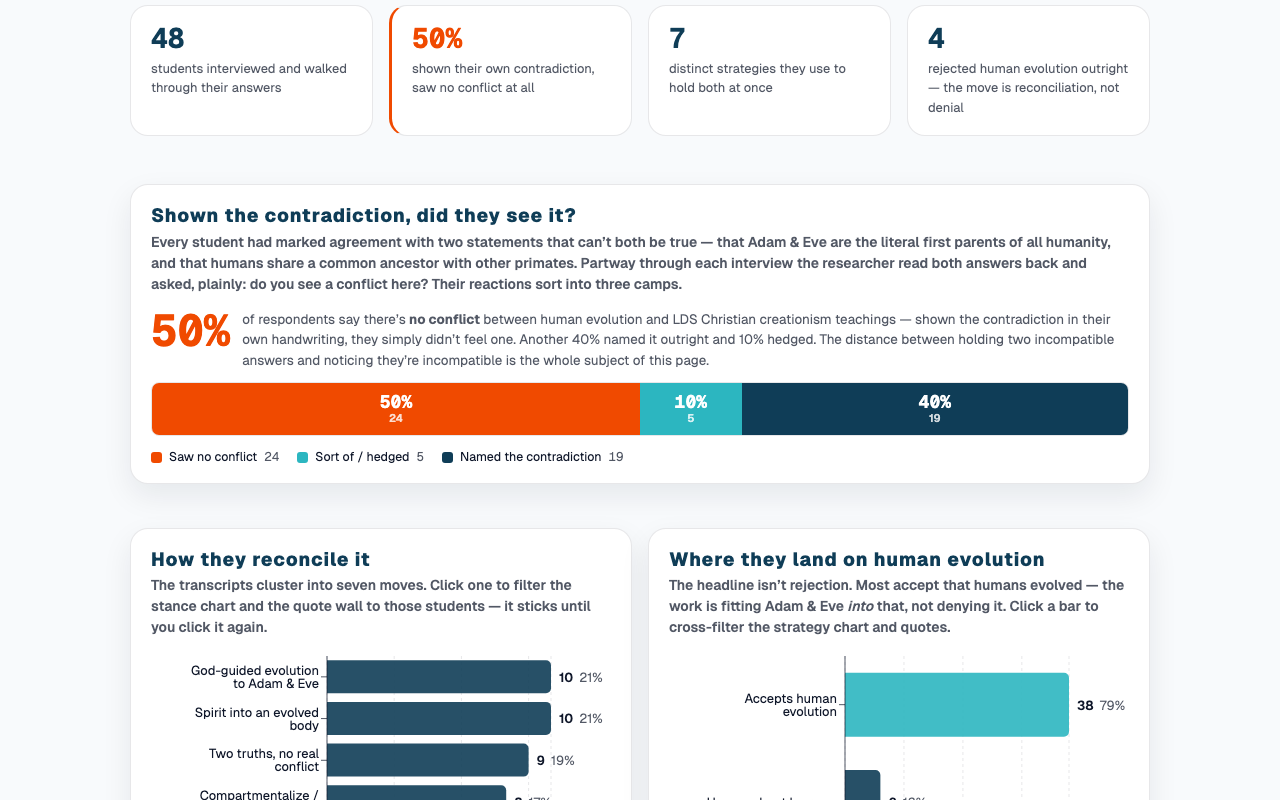
Forty-eight religious university students, read back two of their own contradictory survey answers — “Adam & Eve are our universal ancestors” and “humans share an ancestor with apes.” Half saw no conflict at all. Built from a public BYU interview-transcript deposit: the seven moves they use to hold both at once, and a wall of the transcripts verbatim (“we got our latest model, let’s, Adam and Eve let’s go”).
The Happiness Reports
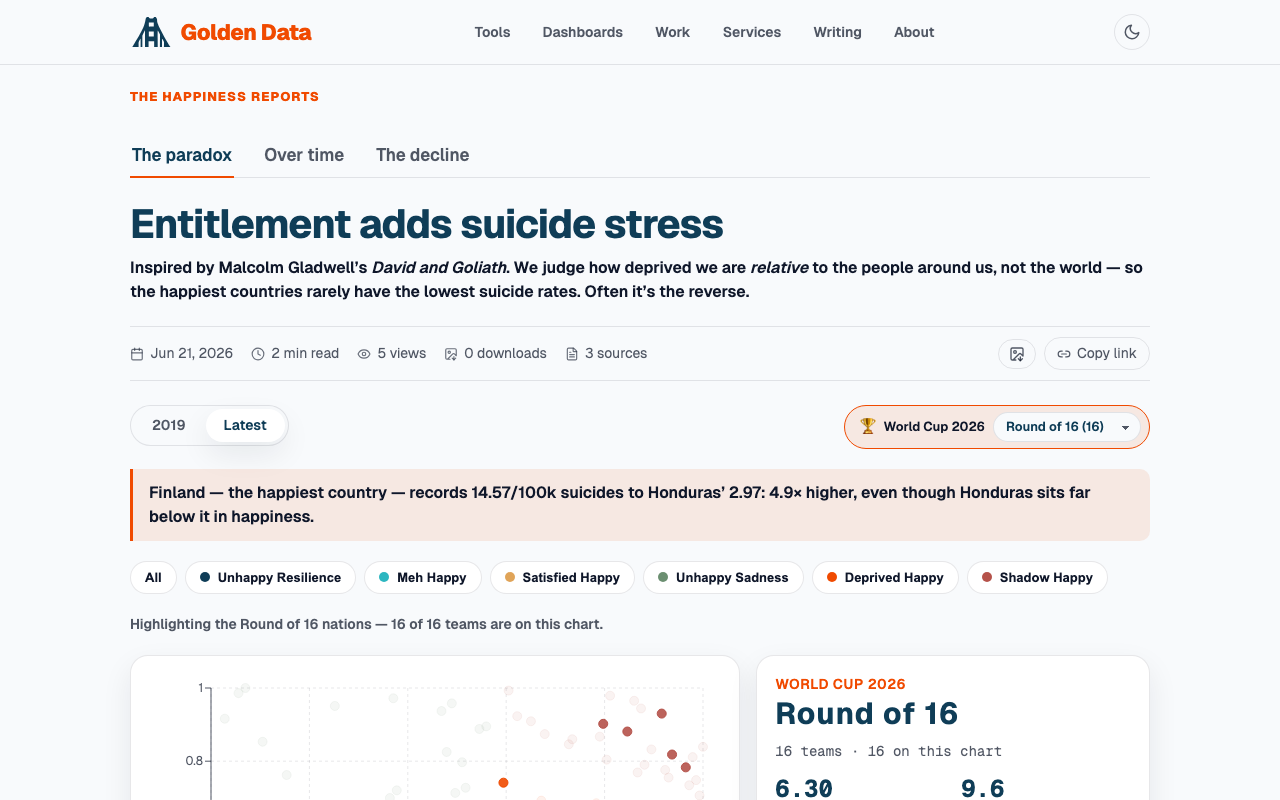
Three reads on happiness and suicide. The paradox: why happy countries like Finland carry high suicide rates (after Gladwell), on a scatter + world map with a World Cup 2026 lens. Over time: a decade stacked against GDP, where the gap widened and a third of countries grew richer yet sadder. And the decline: world suicide rates fell nearly a fifth since 2000 — happiness never noticed.
The offer
A 90-day build of the pipeline, forecast, and capacity systems a revenue team runs on, on your data. Then a monthly bench that keeps them current. Priced on the page.
Golden Data / Briefings
The role, priced as work
The same dashboard engine aimed at a specific role or rival. Most start with a real posting — a company that has already budgeted for the problem. I build the system the role is really buying, then price the build against the salary. Hire the work, not the headcount.
Pick a brief
Husqvarna — Sales Analyst
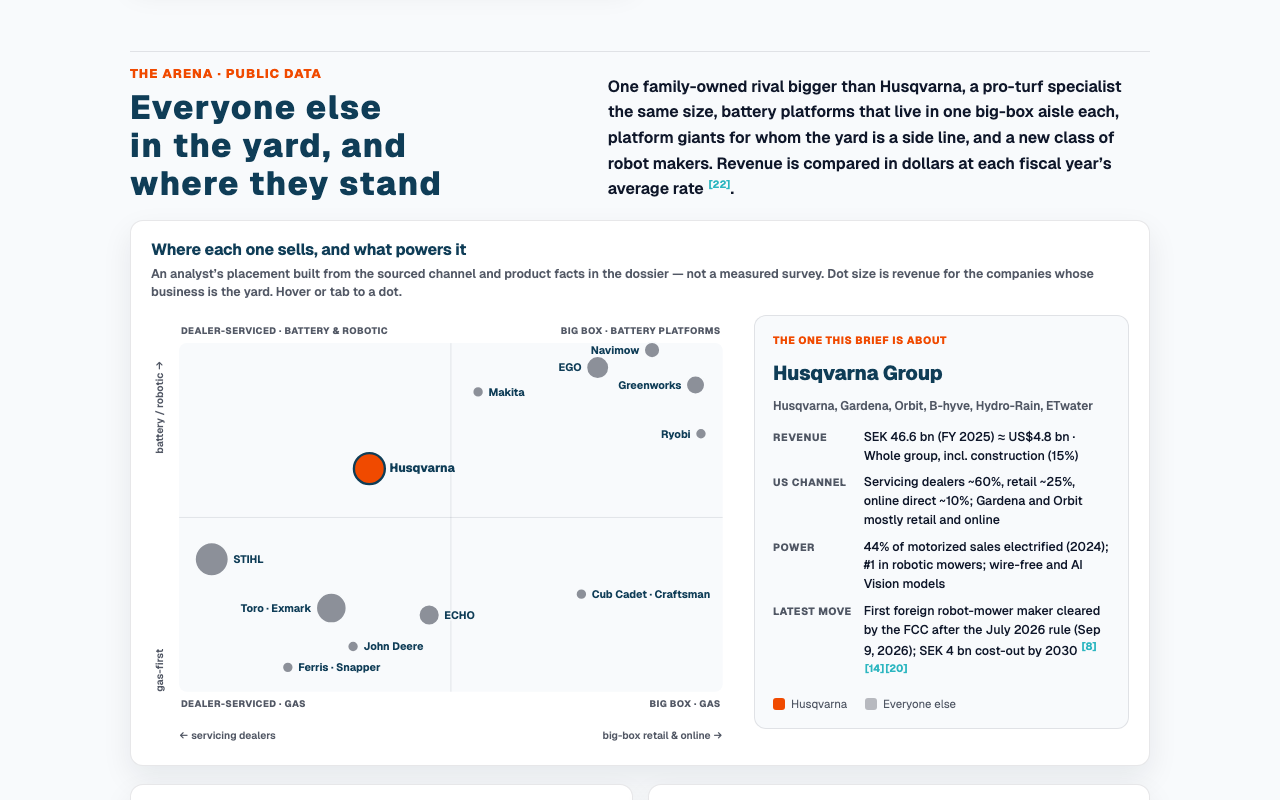
A JD case study for Husqvarna’s Sales Analyst seat in North Salt Lake, written as an ode to four years running my own lawn route and every summer on a landscaping crew. A sourced read on the outdoor-power and watering arena — who sells what, through which door, on which fuel — five ways Husqvarna can differentiate, and a working pricing desk: pocket-price waterfall, variance-to-Plan bridge, upload gate, and program ROI on illustrative data.
Salomon — Senior Manager, Sales Operations, Data & Forecasting
A JD case study for Salomon’s North America sales-operations seat in Ogden — the analytical backbone of a seasonal wholesale book: one consolidated forecast, a Power BI layer with governed definitions and row-level security, a plan-to-sell-through funnel that decomposes every miss, and the team that runs it. Illustrative data only.
Golden Data Analytics — the People Analytics wedge
A use case built by reading UKG Pro People Analytics against itself — its own product sheet routes “ideal” dashboards through paid professional services, prices nothing, and benchmarks from an unnamed data collection. The counter-offer: a governed, narrative, sourced HR analytics layer assembled from four things already running on this site, priced in the open.
Gong — People Analytics Manager
A JD case study for Gong’s people-analytics seat — the wedge battlecard from the Golden Data Analytics teardown, aimed at a posting that names the whole seam: Workday, CultureAmp, and Greenhouse as sources, dbt and Snowflake as the stack, governance and responsible AI adoption as the mandate. Illustrative data only.
Synchrony — AVP, Analytics, Health & Wellness Sales
A JD case study for Synchrony’s Health & Wellness sales-analytics seat — one truth layer for four B2B sales teams covering 280,000+ providers: governed metric definitions, a provider coverage-to-production funnel, test-and-control initiative measurement, and executive dashboards a divisional CEO reads. Illustrative data only.
Acima — Data Scientist, Fraud Prevention & Risk Analytics
A JD case study for Acima’s own fraud data-science role — the fraud decision waterfall (identity, velocity/device, the ML score), the hybrid rules+ML operating point, and the fraud-loss-vs-friction frontier. The one role in the set written from the inside: Acima’s lease-to-own funnel is the book I worked.
PE portfolio — Applied AI Engineer (Forward-Deployed)
The stretch goal: a forward-deployed AI engineer embedded across a PE portfolio. Honest that full-stack at staff depth is the reach — but the AI-native half (Claude Code, MCP servers, custom skills, context engineering, tool benchmarking, enablement) is my daily practice, and this whole site is the proof. The spine is reuse: build once, redeploy across the portfolio.
Wealth-tech CRM — Sr RevOps Engineer (GTM Systems)
The off-thesis one: a RevOps / GTM-systems role, not an analytics seat. Reframed around the part that’s hard to hire for — a trustworthy lead-to-revenue funnel with data quality and AI-native workflows on top — and honest about where Salesforce/CPQ admin depth is the ramp. The same full-funnel engine, pointed at a GTM stack.
Start here — one engine, many roles
The through-line behind the whole portfolio: one analytical engine — full-funnel, LTV, experimentation, exec scorecards, Voice-of-Customer — reskinned across competitor spotlights, JD case studies, and AI-enabled work.
Synchrony — VP, Co-Brand & Lifecycle Analytics
A JD case study: the mandate reframed, a 90-day plan, a co-brand cardholder lifecycle funnel, and a requirement→proof map — the same lifecycle-analytics engine I built for Acima, pointed at a co-brand card book.
Affirm — Director, Analytics (Strategic Insights)
A JD case study for Affirm’s Strategic Insights role — the BNPL consumer lifecycle and the Card-attach growth lever, with proof that pairs to my full Affirm competitor spotlight.
Concora Credit — VP, Risk (Fraud Strategy & Analytics)
A JD case study for a subprime credit-card risk leader — the decisioning funnel (first-payment default, charge-offs, the approval/loss frontier), mapped to the Acima risk model I built. The closest fit in the set to that role’s actual day.
Chime — Director, Product Analytics
A JD case study for Chime’s Product Analytics role — the neobank member lifecycle, the direct-deposit activation unlock, and an experimentation-first 90-day plan, with proof mapped to the Dave spotlight.
Airbnb — Staff, Payments Advanced Analytics
A JD case study for Airbnb’s Payments analytics role — the payment funnel, an authorization-rate causal experiment, and the same experimentation + exec-scorecard engine, pointed at money movement.
Headspace — Director, AI Enablement
A different kind of case study: this portfolio IS the proof. A dozen-plus sourced, cited analyses shipped via an AI research→build operating model I designed — discovery→pilot→scale, with responsible-AI guardrails on every page.
Target — Director, Quantitative UX Research & AI Enablement
A JD case study for Target’s Quantitative UX Research role — behavior-vs-voice measurement and a VoC research signal, mapped to my CX Research & Market Intelligence brief and AI-scaled research workflows.
Best Buy — Director, Customer Insights & Integration
A JD case study for Best Buy’s Customer Insights role — the retail customer lifecycle and the channel-integration payoff, mapped to the lifecycle-analytics engine.
Citizens — Head of Decisioning Analytics & Optimization
A JD case study for Citizens’ decisioning role — the portfolio decision funnel optimized end-to-end against profitability, mapped to the decision-optimization engine.
Competitor Spotlight: Progressive Leasing
A deep-dive on Progressive Leasing / PROG Holdings (NYSE: PRG) — Acima’s purest pure-play mirror, the virtual-LTO rival Acima overtook on GMV in FY2025. Includes the $175M FTC settlement. Public data, every figure cited.
Competitor Spotlight: Dave
A deep-dive on Dave (NASDAQ: DAVE) — Brigit’s most direct competitor, already 2–3× its size, GAAP-profitable, with a banking flywheel Brigit lacks. Public data, every figure cited.
Upbound — Customer Performance Analytics
Inside Acima’s funnel: an interactive unit-economics & LTV model calibrated to the filed FY2025 results, a leakage diagnostic, an experimentation readout, and the SQL underneath. Public data only.
Upbound — Competitive & Market Intelligence
An original market-intelligence briefing on Upbound Group (Acima, Rent-A-Center, Brigit) and the accessible-finance arena — lease-to-own vs BNPL vs cash advance. Every figure sourced and dated.
Competitor Spotlight: Affirm
A deep-dive on Affirm (NASDAQ: AFRM) — the no-late-fee, simple-interest, prime-leaning BNPL that sets the transparency benchmark high-take-rate lease-to-own is judged against. Public data, every figure cited.
Competitor Spotlight: Sezzle
A deep-dive on Sezzle (NASDAQ: SEZL) — the subprime-leaning, super-app-building BNPL on a collision course with Acima and Brigit. Trajectory, business model, head-to-head, and implications. Public data, every figure cited.
The offer
A 90-day build of the pipeline, forecast, and capacity systems a revenue team runs on, on your data. Then a monthly bench that keeps them current. Priced on the page.
Golden Data / Work
The work itself, with the decision it serves
Shipped features and dashboards — each tied to the moment someone has to choose, and what changed once it landed. The proof, not the pitch.
The builds
Salary Dashboard
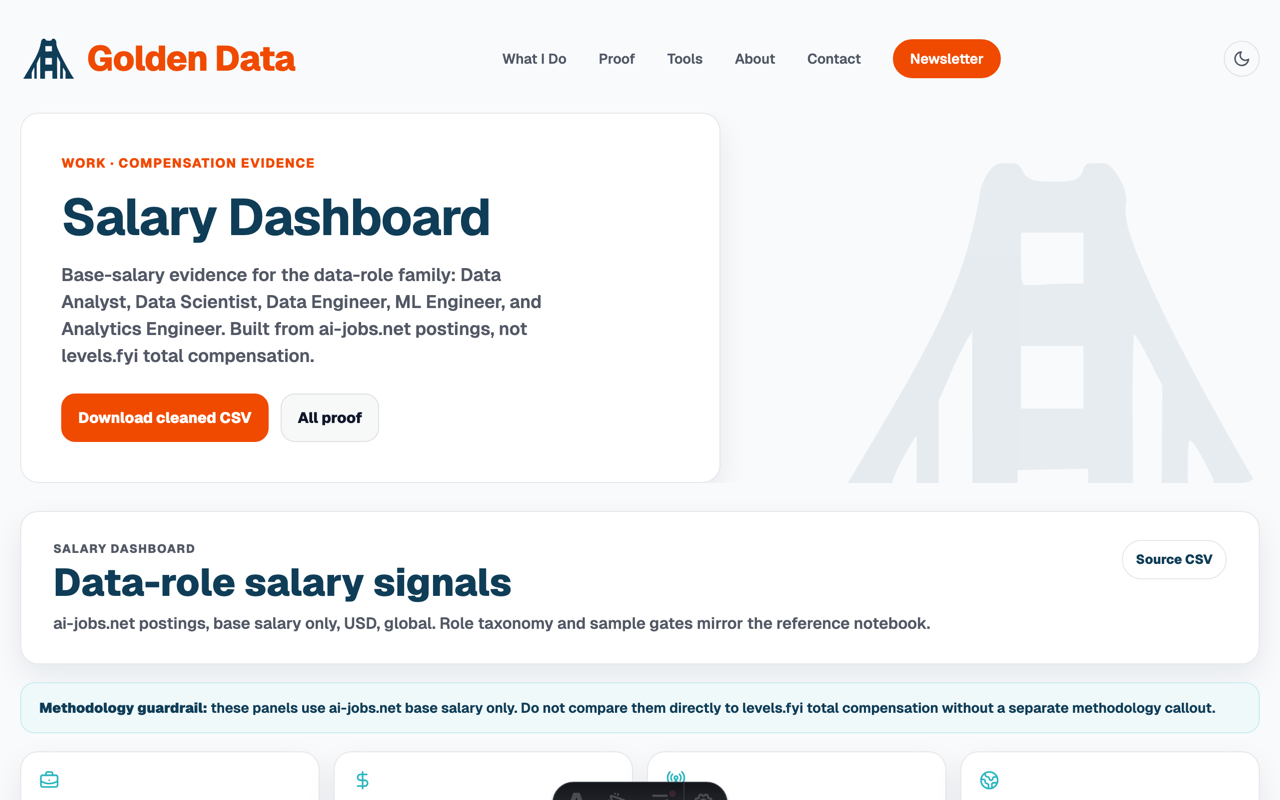
Data-role salary panels from ai-jobs.net postings: base salary only, USD, global, with role classification, per-role outlier trim, sample-size gates, and explicit methodology notes.
Browser GIF & Meme Maker
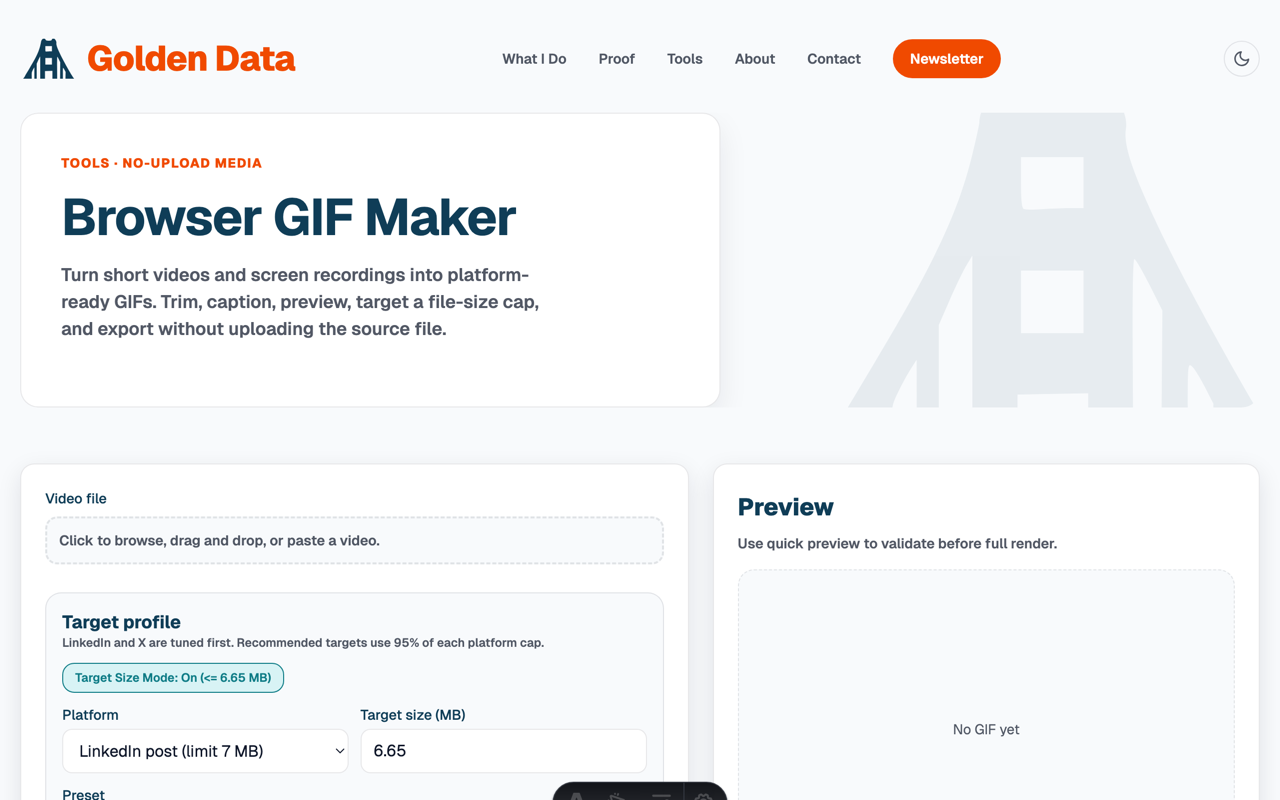
A browser-native meme and GIF maker: place any number of Impact captions on a photo, add a caption bar above it, or convert a short screen recording with trim, boomerang playback, filters, and target-size compression — without sending source files to a server.

High School Pathways
Ogden School District’s degree-requirement PDF rebuilt as a living visual roadmap. Parents see credits earned, gaps to close, and the next decision they need to make.
Economic Dashboard
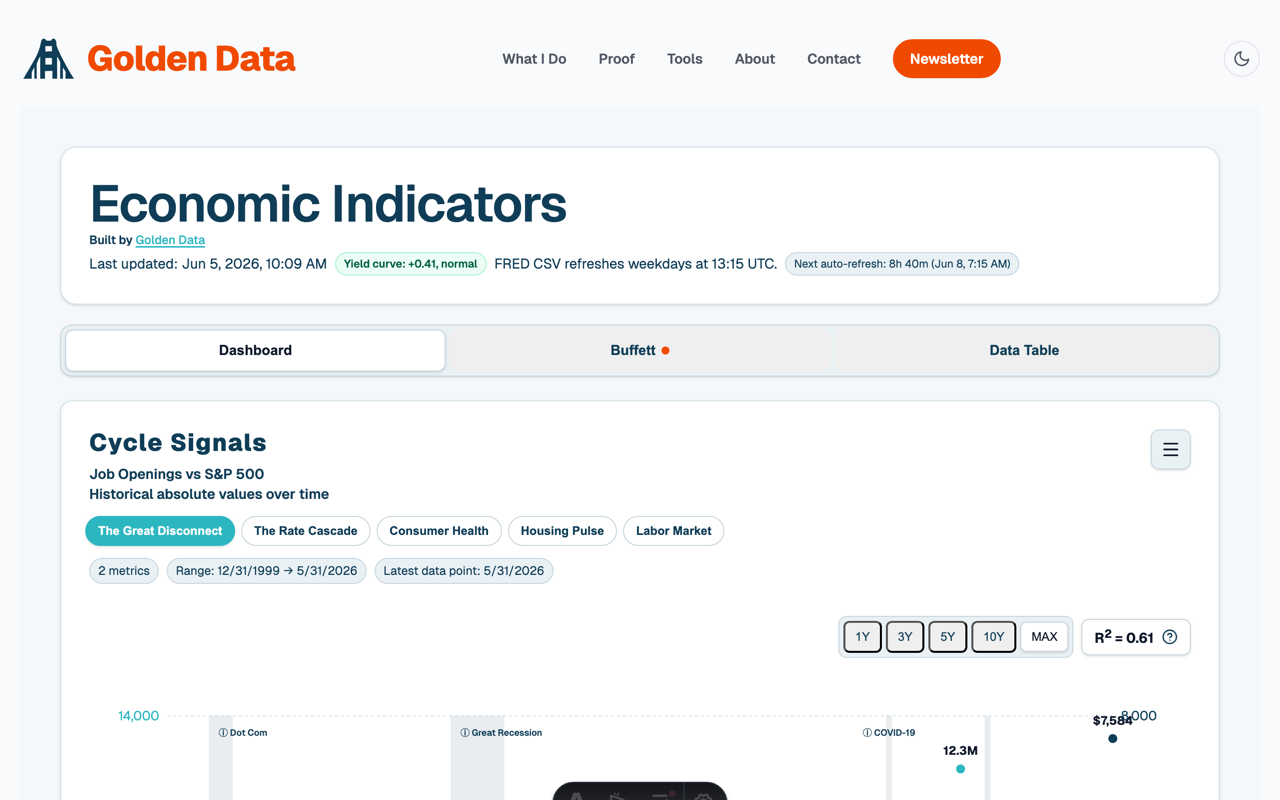
Live macro indicators from FRED — Buffett indicator, yield curve, employment, housing — with a running notebook of what each move means. Refreshed weekdays by a GitHub Action.
Ogden Home Finder
A living catalogue of Ogden-metro housing. Every morning an AI agent scrapes 2BR rentals and for-sale homes; code merges them into a price-tracked catalogue; a gate refuses any run that looks like corruption before it ships. The pipeline’s anatomy is in The Scrape Gate.
The offer
A 90-day build of the pipeline, forecast, and capacity systems a revenue team runs on, on your data. Then a monthly bench that keeps them current. Priced on the page.
Golden Data / Writing
Two columns and a build log
Signal for the people deciding what to build; Crafting for the people doing the work. Plus a running log of everything shipped here, newest first.
Read along
Signal
What B2B SaaS shipped, and what it admits — sales ops, ad tech, analytics, BI. What’s working, what’s bolted on, and one feature I’d build this week.
Crafting
Where the senior analytics craft is moving — the skills climbing the premium curve, the tooling rewriting job descriptions, one move worth making before Monday.
The Build Log
A running log of everything shipped here — a dashboard, a tool, a newsletter issue — newest first. The workbench pulse, in one feed.
The offer
A 90-day build of the pipeline, forecast, and capacity systems a revenue team runs on, on your data. Then a monthly bench that keeps them current. Priced on the page.
Golden Data / Autopilot
This site keeps itself current
Scrapers, validators, and agents refresh the data behind these pages on their own schedules — pull, validate, commit, redeploy — with no one at the keyboard. 4/7 pipelines current, 2,407 records kept live, every figure read at build time from the actual data files.
The pipelines, live
Economic indicators
Pulls fresh series from FRED, validates every one against release-window and drift thresholds, gates on a clean build, commits the snapshot, and lets Vercel redeploy. A failed check opens a GitHub issue and emails an alert instead of shipping bad data.
Ogden housing scrape
Rent.com is parsed deterministically and for-sale listings are read by a Claude agent; scripts/housing-merge.mjs diffs both against the tracked history (first-seen, price changes, dropped listings), scripts/housing-validate.mjs refuses a corrupt catalogue, and only then does the JSON land on main.
JD salary tracker
Pulls recent analytics-leadership openings by role family, rewrites the openings feed and the newsletter digest, and pushes to main.
Ultra running refresh
Re-reads UltraSignup’s public event search around Ogden and re-snapshots the two anonymized Strava views (long runs, weekly roll-up) after the dbt gate has passed them, commits only when a row moved, and lets Vercel rebuild — at build the pages read the views live anyway, so the site is never more than a day behind the log.
Safe-publish layer (dbt)
Anonymized dbt views over the private task database — allow-list models that emit only aggregates, then a leak gate (allow-list, PII patterns, a contacts oracle) plus range and derivation tests. A red test blocks publish; the site never reads a view the gates have not passed.
Release watcher
Asks each publisher in the registry what it has out. When a new release lands and the dataset has a committed fetch script, it runs the script, the tests and the build, and opens a pull request; datasets that need a person go into one issue.
Larder Watch patrol
An agent prices two sworn DoorDash baskets to the same door every Wednesday (never ordering, never tipping, no promos) into the mission-control database, and a Thursday job exports them here. The Larder tab sets them against CPI food prices from the FRED pipeline.
The offer
A 90-day build of the pipeline, forecast, and capacity systems a revenue team runs on, on your data. Then a monthly bench that keeps them current. Priced on the page.
Everything, newest first
Every published thing on the bench in one reverse-chron feed — tools, dashboards, and newsletter issues, mingled. Filter to a kind; deselect to bring the rest back.
- The Scrape GateAn AI agent scrapes Ogden housing every morning and commits it to this site with no one reviewing it. The model only reads; code owns the keys and the history; a gate refuses any run that looks like corruption rather than a market move. Every scrape since June replayed through the gate: the move to an always-on runner stopped the missed days, but not the bad runs, like the one that added 158 duplicate homes overnight. The replay also caught a quiet one: “active” had stopped meaning on the market, with more than half the homes unseen for a week. The backlog the gate can’t fix is on the page too.
- Below Replacement, Even in UtahThe world’s fertility rate has more than halved since 1963, and two in three people now live in a country below replacement; the U.S. hit a record low of 1.60 in 2024. Utah had the highest rate of any state every year from 2005 to 2015, fell below 2.1 in 2018, and from any start year 2010–2016 has fallen further than any other state. Every state 2005–2024 from NCHS final data, “Utah fell furthest” checked measure by measure, and six explanations tested against all fifty states: later marriage fits best.
- The Agent Answers The Question You Modeled For. Vision Is Modeling For The One Nobody Has Asked YetThe intent did not port
- BriefHusqvarna — Sales AnalystA JD case study for Husqvarna’s Sales Analyst seat in North Salt Lake, written as an ode to four years running my own lawn route and every summer on a landscaping crew. A sourced read on the outdoor-power and watering arena — who sells what, through which door, on which fuel — five ways Husqvarna can differentiate, and a working pricing desk: pocket-price waterfall, variance-to-Plan bridge, upload gate, and program ROI on illustrative data.
- Four Thousand WeeksBurkeman’s four thousand weeks as a grid you can put your own birthday into: every week you’ve lived filled in, every week ahead an outline, with the SSA’s odds you’ll reach each age on top. Then who gets the rest, from the American Time Use Survey: more time alone, about as much with a partner, coworkers and kids falling away. Add your kids and it does the tail-end arithmetic from 145,000 raw diaries: nearly half of a parent’s at-home hours with a child are gone by the seventh birthday.
- 50 Years of LDS Growth: Record Counts, Not Record GrowthThe Church of Jesus Christ of Latter-day Saints set real records in 2025–26: 385,490 convert baptisms and 90,000+ missionaries. This rebuild of my Tableau viz concedes every count, then sets each one beside its per-member rate: 22 converts per 1,000 members against 45 in 1990, a U.S. count that fell by 186 in 2025 while the rest of the world grew, and Pew’s U.S. retention down from 70% to 54%. Plus fifty years of growth decade by decade (five times the members, slower every decade), a heads-vs-hours missionary model and a claims-vs-numbers table.
- Omni Let Anyone Build the App. The Analyst Still Owns the Definition.Omni shipped a way for anyone to build a governed app on the semantic model in five weekly drops; the half of the analyst's job that got automated was the dashboard, and the half that got more expensive was the definition underneath it.
- Two Surfaces Now Answer Every Question Fluently. Somebody Still Has To Say Which One Is Right.The authority did not port.
- The CRM stopped waiting for the rep.Momentum is aimed at general availability at Dreamforce this week, Winter '27 puts agent activity in the forecast grid, and a Validity survey finds only 21% of marketers call their CRM data ready for the agents now writing to it, so the operator's build is a ledger of which opportunity fields a machine wrote.
- ToolRace FinderEvery race UltraSignup lists within 250 miles of Ogden, on a map and ranked against my own profile: the distance bands around my longest race, trail over road, the months I race, recovery after my target, the drive. Every score prints its reasons. My record sits on the same map with the times from my Strava log. Star the ones worth a look; your stars and preferences stay in your browser. Refreshed daily.
- Past Thirteen MilesEvery run of half-marathon distance or longer I have logged since 2020, fed live from my Strava table through an anonymized view — then the official ultras reviewed one by one: the Buffalo Run 50K, two editions of the Skyline 55K a year apart, and the Canyonlands 50 Mile course — the target for October 24, not a bib yet — sized up against my own numbers.
- Uber cut the middle rung. The top two are now close enough to touchUber cut 20% of its managers on September 2 the same week Paul's own JD tracker caught one company posting an identical pay band for a Staff analyst role and a Manager role — the receipt behind a report that says the AI premium pays builders more than it pays bosses.
- The Sales Forecast Got a Second AuthorSalesforce and Anthropic's Claudeforce lets one admin connect Claude to the whole CRM and every seller gets governed write access from day one — the eval question is what Claude does with an account nobody has cleaned up, and Sales Ops is the team that finds out.
- ToolTraining Holdout PlannerTurn a training rollout into a readable test. Enter the rep pool, the KPI baseline, and the lift you would act on; get the one-page plan a leadership team can sign: who waits, what decides, when we read, how big the holdout must be. Print it or copy it as Markdown.
- ToolStrava Activity StitcherEnded the hike by accident at the turnaround and recorded the way back as a second activity? Drop both TCX exports in and get one file back with every point intact. It shows what it keeps, what it shifts, and what it leaves empty, and asks twice before it builds. Nothing is invented; nothing is uploaded.
- Leverage MapPersonal interventions plotted by friction vs. payoff — what I already do, what’s next, what’s noise.
- The Switching Raise Collapsed. The Postings Still Promise One.ADP's September 2 pay data puts the raise for changing jobs at 1.7 points over staying, Bank of America says the top 5% of earners who stayed now out-earn the ones who left, and the postings in my own tracker still price the walk. The move this week is the page that makes staying pay.
- +53% Wasn't EnoughThe Trade Desk cut 15% of its staff on September 4, closing an ad-tech earnings season that fit inside 48 hours in early August. Three companies posted growth from great to terrible and all three got punished; the one that got paid had the most boring number. The market has stopped extending credit to the AI story between one quarter and the next.
- The Warehouse Can Read All 300 Of Your Measures. It Still Can't Tell Which One The Room Decides On.
- The Page Was Worth Twenty PointsA 4 KB hand-written markdown file describing what a retail dataset means was worth 17 to 23 points of text-to-SQL accuracy to three frontier models — and switching between the models was worth nothing. Cube’s 99-question benchmark, the literature band behind it, what the page cost in tokens, and what survives when a semantic model migrates. The page, not the model, was the lever — and that page is an SOP.
- Snowflake And Databricks Now Ingest Your Power BI Model. Most Of Your Skill Is In The Part They Skip.For twenty years the semantic model was the hostage. It walked out this month. Read what it left in the room.
- DoorDash open-sourced the robot that writes their code. I made it do my choresWhat a $3.01 feature taught me about who holds the keys
- Three Vendors Retired Their Agents. One Named a Date.AWS retired Bedrock Agents with no deadline and no end-of-life date, which is harder to plan against than a sunset, and the skill quietly repricing is the one that turns a vendor's ambiguity into a dated plan.
- They deprecated the part that worked.AWS closed Bedrock Agents to new customers on July 30 and renamed it Classic, OpenAI removes the Assistants API on August 26 after a twelve-month notice, and a July 19 decomposition of a production agent found most of its accuracy came from scaffolding — the exact layer three vendors are asking you to rebuild.
- They revised away 103,000 jobs. The seniority data held.Payrolls fell 23,000 in July and the prior two months were revised away by 103,000, two days after a panel of economists called the unemployment rate in the wrong direction — but the seniority cut of the same data is unambiguous, and it points at the roles I am aiming at.
- BriefSalomon — Senior Manager, Sales Operations, Data & ForecastingA JD case study for Salomon’s North America sales-operations seat in Ogden — the analytical backbone of a seasonal wholesale book: one consolidated forecast, a Power BI layer with governed definitions and row-level security, a plan-to-sell-through funnel that decomposes every miss, and the team that runs it. Illustrative data only.
- BriefGolden Data Analytics — the People Analytics wedgeA use case built by reading UKG Pro People Analytics against itself — its own product sheet routes “ideal” dashboards through paid professional services, prices nothing, and benchmarks from an unnamed data collection. The counter-offer: a governed, narrative, sourced HR analytics layer assembled from four things already running on this site, priced in the open.
- BriefGong — People Analytics ManagerA JD case study for Gong’s people-analytics seat — the wedge battlecard from the Golden Data Analytics teardown, aimed at a posting that names the whole seam: Workday, CultureAmp, and Greenhouse as sources, dbt and Snowflake as the stack, governance and responsible AI adoption as the mandate. Illustrative data only.
- Snap Lost Users and Rose 14%. Pinterest Set a Record and Fell.Snap's North American users fell 7% and the stock rose 14%. Its North American ARPU rose 23% to $10.26. Pinterest set a user record and fell 9% on the cost of the AI buildout. Last issue's engagement thesis was wrong, and the reason it was wrong is that I was reading the year-over-year line while the market was reading the sequential one.
- BriefSynchrony — AVP, Analytics, Health & Wellness SalesA JD case study for Synchrony’s Health & Wellness sales-analytics seat — one truth layer for four B2B sales teams covering 280,000+ providers: governed metric definitions, a provider coverage-to-production funnel, test-and-control initiative measurement, and executive dashboards a divisional CEO reads. Illustrative data only.
- The vendor wrote the definition of successSalesforce made Agentforce Help Agent generally available this month at $2 per autonomous resolution, HubSpot metered custom agents by the run on July 23 while its packaged agents bill by outcome, and a June 30 validity audit found tool-calling evaluators disagree with human judgment 18.5% of the time. You now buy an outcome your vendor defines, scores, and invoices.
- The Layoff Tracker Is Written for Investors. Most ICs Read It as a Verdict.
- The wrong answer costs the most.Databricks metered Genie Agents on July 8, made it free on July 15, and reversed the charges on July 21 — and every cost control it shipped in six weeks points at the same thing, which is not the question but the retry.
- ToolBackground RemoverDrop in a photo or a screenshot, cut the backdrop out, and download a transparent PNG. It only takes background that touches an edge, so a white shirt in the middle of the frame survives. Nothing is uploaded.
- ToolSuper PAC Structure PickerSix questions — money to candidates, money above the limits, donors public or not, who is behind it — and out comes the committee type you actually need, the FEC Form 1 box to check, the filing calendar, and your "paid for by" line.
- The Leak GateThe agent-vs-human scorecard reads my real task manager — titles, notes, and people attached — and publishes none of it. The anatomy of the dbt layer in between: allow-list models that emit only aggregates, a leak gate with an oracle built from the private contacts table, and the week a mutable timestamp restamped 90 days of history into two buckets without failing a single test. The incident is now a test.
- The Metric Definition Is Becoming a File. Most Portfolios Are Still a Dashboard.Two standards bodies moved this month toward the same thing: a metric definition that lives as a version-controlled file instead of a formula inside a dashboard. The senior analytics interview is already screening for it. Here is the sixty-minute version.
- The product stopped being a place.On July 14, 2026 Salesforce, Clari + Salesloft, Glean, and SnapLogic all shipped a way for something that is not a person to use their software — and the only asset that survived the removal of the interface was the rule about who is allowed to read what.
- AI Redundancy Washing Has a Tell.Deutsche Bank's "AI redundancy washing" is now the defining feature of 2026's layoffs, and for senior analytics ICs the job postings from the same companies doing the cutting are a truer signal than the layoff tracker.
- BriefAcima — Data Scientist, Fraud Prevention & Risk AnalyticsA JD case study for Acima’s own fraud data-science role — the fraud decision waterfall (identity, velocity/device, the ML score), the hybrid rules+ML operating point, and the fraud-loss-vs-friction frontier. The one role in the set written from the inside: Acima’s lease-to-own funnel is the book I worked.
- The AI budget got a meterThe AI budget got a meter this fortnight. OpenAI shipped credit-level spend caps on June 18; Microsoft, Anthropic, and Databricks matched inside eighteen days. Four vendors moved AI spend out of the CFO's blind spot and onto the governance surface the CFO already reads — and moved themselves onto a consumption bill at the same time.
- The Free AI Trial Ended. The Bill Didn't.Databricks flipped Genie to metered billing today, Snowflake decoupled AI spend from compute in April, and Uber and Meta already blew through their 2026 AI budgets — the senior analytics IC who can build the cost-attribution query is the one explaining the invoice, not the one blindsided by it.
- The Week That Had No WeekendIn 1929 the Soviet Union tried to abolish the weekend. The nepreryvka split the workforce into five colour groups on a rotating five-day cycle — four-fifths always working, so the factories never stopped, and no universal Sunday to anchor religious life. The staggering fractured families: pick two people’s colours and watch their days off never line up. Traces the calendar from the five-day week to the six-day shestidnevka to the seven-day week’s return in 1940 — and debunks the two myths the story usually carries.
- When Sweden Vacations TogetherTerry Hartig tracked how many antidepressants Swedish pharmacists dispensed, month by month, for twelve years. The more workers were on vacation at the same time, the fewer prescriptions went out that month — and the effect reached retirees too, who had no job to break from. Evidence that rest is contagious. Rebuilt from the paper’s published ARIMA coefficients: an exact dose-response curve, the drop group-by-group, and a reconstruction of the raw seasonal series.
- The Agent-vs-Human ScorecardThe workbench measured on itself over a rolling 90-day window. Every task is tagged with who did it — agent or human — and this is the two-column readout of that split: outcome rate, dollars per instance, and minutes to complete. Fed live at build time from anonymized database views (see the dbt leak gate) that never expose a task title, note, or category.
- The SDR job got sold in pieces.HubSpot acquired Warmly on June 30, Salesforce paid $3.6 billion for Fin on June 15, Salesforce's Summer '26 shipped Momentum and a Customer Engagement Agent on June 15, and 6sense turned engaged-account lists into named CRM-ready contacts on June 22 — four moves this fortnight saying the sales rep's day stopped being the unit the software vendor priced against.
- ToolPipeline Coverage PlannerQuota, closed-won, open pipeline, and win rate in — coverage ratio, projected finish, and the pipeline you still have to build (in deals, per week) out. The quarter math, without the spreadsheet.
- ToolSales Capacity PlannerWill the team you have hit the number you signed up for? Reps, ramp, attainment, and attrition in — effective selling capacity, the gap to plan, and what it takes to close it.
- ToolComp Plan Payout CurveA comp plan is a curve, not a paragraph. OTE, pay mix, threshold, accelerator, and cap in — the whole plan drawn live, with total cash at attainment and what the next point is worth.
- ToolSaaS Metrics ScorecardThe five numbers a revenue leader gets asked for first — NRR, GRR, magic number, CAC payback, Rule of 40 — computed from raw inputs and scored against public benchmarks.
- Oracle's 10-K Said What the Press Releases Didn't.Oracle's fiscal 2026 10-K named AI as the direct cause of 21,000 layoffs this week, while PwC's 2026 AI Jobs Barometer confirmed a 62% wage premium for AI-skilled roles — together, two data points that answer the career question most senior analytics ICs have been putting off.
- The BI Brief Changed in June. The JD Hasn't.Microsoft Build 2026 shipped Agent Skills for Power BI — AI that writes reports from screenshots — and the $30K–$65K Fabric governance premium now has a visible job description gap behind it.
- Productivity Has Left Wages in the DustFor a generation the typical worker’s pay rose right alongside what they produced. Around 1973 the lines split — net productivity is up +298% since 1948, worker pay only +143% — and the wedge between them is income workers generated but didn’t take home. The setup for the obvious next question: will the AI productivity surge flow back to pay, or repeat the pattern? Fed by EPI’s State of Working America data.
- How Far CEO Pay Pulled AwayIn 1965 a big-company CEO made about 21 times a typical worker; the ratio peaked at 408:1 in 2021 and sits at 280:1 today. Because executive pay is mostly stock, the line swings with the market — toggle the S&P 500 overlay to see it track. The options-realized measure for the 350 largest U.S. firms, fed by EPI’s State of Working America data — then search a company you know for its own ratio, straight from its SEC proxy.
- The dashboard wrote itself.Microsoft open-sourced Fabric Skills for Claude and GitHub Copilot through the June Fabric Updates Blog, Databricks made Genie One GA at Data + AI Summit on June 16 with Unity Catalog Metrics turned into governed objects the agent drafts against, ThoughtSpot integrated Spotter with Snowflake Cortex AI and Semantic Views at Snowflake Summit 26 on June 2, and Sigma Agents went Public Beta on June 12 with MCP tool support — four BI vendors this fortnight stopped shipping the dashboard the analyst clicked and started shipping the agent that authors the model behind it.
- BriefPE portfolio — Applied AI Engineer (Forward-Deployed)The stretch goal: a forward-deployed AI engineer embedded across a PE portfolio. Honest that full-stack at staff depth is the reach — but the AI-native half (Claude Code, MCP servers, custom skills, context engineering, tool benchmarking, enablement) is my daily practice, and this whole site is the proof. The spine is reuse: build once, redeploy across the portfolio.
- Nuclear Weapon InventoryEvery nuclear warhead on Earth, year by year since 1945. The stockpile peaked at 64,452 in 1986 and has fallen 85% since — almost all of it the US and Russia dismantling Cold-War arsenals. Flip between total stockpile and the year-over-year buildup/teardown, overlay the arms-control treaties, and isolate any of the nine arsenals on a linked world map. Fed by an FAS/Our World in Data feed that refreshes year to year.
- BriefWealth-tech CRM — Sr RevOps Engineer (GTM Systems)The off-thesis one: a RevOps / GTM-systems role, not an analytics seat. Reframed around the part that’s hard to hire for — a trustworthy lead-to-revenue funnel with data quality and AI-native workflows on top — and honest about where Salesforce/CPQ admin depth is the ramp. The same full-funnel engine, pointed at a GTM stack.
- Every Staff Analytics JD Lists dbt. Here's What It Actually Does — and Why It's the Trust Layer.A field guide to the trust layer underneath every modern data stack — and why the job descriptions never explain it.
- Topology of MusicEvery song I’ve logged since 2019, rebuilt from Tableau as a “mountain range” of my top-15 artists. Not just who I played most, but who I stayed loyal to — each artist climbs for every return inside four days and dips when I let them lapse. deadmau5 never stops climbing.
- Mormon Pioneer Trek to the Salt Lake ValleyThe 56,000 Latter-day Saints who walked 1,300 miles to the Salt Lake Valley, rebuilt from Tableau as one themed dashboard. A young people’s migration (58% under 25), cholera as the trail’s defining killer, a U-shaped mortality curve — and the Company Type filter made real: pick Willie & Martin to watch mortality jump to 16.5%.
- Faith and Human Evolution: Mental GymnasticsForty-eight religious university students, read back two of their own contradictory survey answers — “Adam & Eve are our universal ancestors” and “humans share an ancestor with apes.” Half saw no conflict at all. Built from a public BYU interview-transcript deposit: the seven moves they use to hold both at once, and a wall of the transcripts verbatim (“we got our latest model, let’s, Adam and Eve let’s go”).
- BriefStart here — one engine, many rolesThe through-line behind the whole portfolio: one analytical engine — full-funnel, LTV, experimentation, exec scorecards, Voice-of-Customer — reskinned across competitor spotlights, JD case studies, and AI-enabled work.
- BriefSynchrony — VP, Co-Brand & Lifecycle AnalyticsA JD case study: the mandate reframed, a 90-day plan, a co-brand cardholder lifecycle funnel, and a requirement→proof map — the same lifecycle-analytics engine I built for Acima, pointed at a co-brand card book.
- BriefAffirm — Director, Analytics (Strategic Insights)A JD case study for Affirm’s Strategic Insights role — the BNPL consumer lifecycle and the Card-attach growth lever, with proof that pairs to my full Affirm competitor spotlight.
- BriefConcora Credit — VP, Risk (Fraud Strategy & Analytics)A JD case study for a subprime credit-card risk leader — the decisioning funnel (first-payment default, charge-offs, the approval/loss frontier), mapped to the Acima risk model I built. The closest fit in the set to that role’s actual day.
- BriefChime — Director, Product AnalyticsA JD case study for Chime’s Product Analytics role — the neobank member lifecycle, the direct-deposit activation unlock, and an experimentation-first 90-day plan, with proof mapped to the Dave spotlight.
- BriefAirbnb — Staff, Payments Advanced AnalyticsA JD case study for Airbnb’s Payments analytics role — the payment funnel, an authorization-rate causal experiment, and the same experimentation + exec-scorecard engine, pointed at money movement.
- BriefHeadspace — Director, AI EnablementA different kind of case study: this portfolio IS the proof. A dozen-plus sourced, cited analyses shipped via an AI research→build operating model I designed — discovery→pilot→scale, with responsible-AI guardrails on every page.
- BriefTarget — Director, Quantitative UX Research & AI EnablementA JD case study for Target’s Quantitative UX Research role — behavior-vs-voice measurement and a VoC research signal, mapped to my CX Research & Market Intelligence brief and AI-scaled research workflows.
- BriefBest Buy — Director, Customer Insights & IntegrationA JD case study for Best Buy’s Customer Insights role — the retail customer lifecycle and the channel-integration payoff, mapped to the lifecycle-analytics engine.
- BriefCitizens — Head of Decisioning Analytics & OptimizationA JD case study for Citizens’ decisioning role — the portfolio decision funnel optimized end-to-end against profitability, mapped to the decision-optimization engine.
- BriefCompetitor Spotlight: Progressive LeasingA deep-dive on Progressive Leasing / PROG Holdings (NYSE: PRG) — Acima’s purest pure-play mirror, the virtual-LTO rival Acima overtook on GMV in FY2025. Includes the $175M FTC settlement. Public data, every figure cited.
- BriefCompetitor Spotlight: DaveA deep-dive on Dave (NASDAQ: DAVE) — Brigit’s most direct competitor, already 2–3× its size, GAAP-profitable, with a banking flywheel Brigit lacks. Public data, every figure cited.
- BriefUpbound — Customer Performance AnalyticsInside Acima’s funnel: an interactive unit-economics & LTV model calibrated to the filed FY2025 results, a leakage diagnostic, an experimentation readout, and the SQL underneath. Public data only.
- BriefUpbound — Competitive & Market IntelligenceAn original market-intelligence briefing on Upbound Group (Acima, Rent-A-Center, Brigit) and the accessible-finance arena — lease-to-own vs BNPL vs cash advance. Every figure sourced and dated.
- BriefCompetitor Spotlight: AffirmA deep-dive on Affirm (NASDAQ: AFRM) — the no-late-fee, simple-interest, prime-leaning BNPL that sets the transparency benchmark high-take-rate lease-to-own is judged against. Public data, every figure cited.
- BriefCompetitor Spotlight: SezzleA deep-dive on Sezzle (NASDAQ: SEZL) — the subprime-leaning, super-app-building BNPL on a collision course with Acima and Brigit. Trajectory, business model, head-to-head, and implications. Public data, every figure cited.
- The Happiness ReportsThree reads on happiness and suicide. The paradox: why happy countries like Finland carry high suicide rates (after Gladwell), on a scatter + world map with a World Cup 2026 lens. Over time: a decade stacked against GDP, where the gap widened and a third of countries grew richer yet sadder. And the decline: world suicide rates fell nearly a fifth since 2000 — happiness never noticed.
- The platform shipped the badge.Four platform vendors stopped pitching the agent this fortnight and started shipping the badge it has to wear.
- The agent became a graph.Salesforce ships Multi-Agent Orchestration GA on June 15, ServiceNow Autonomous CRM names production volumes, Anthropic Claude Managed Agents goes multi-agent with Netflix in production, and a reliability paper measures the gap — four moves in one fortnight saying the AI feature stopped being a single LLM call.
- The Analytics Interview Changed This Month. Most Prep Is Still for Last Month.The dbt Developer Agent shipped this month, Meta and Shopify now allow AI in technical interviews, and Ravio's 2026 comp data documented a 12% AI/ML IC premium alongside a 73% collapse in entry-level analytics hiring. The interview changed. Most prep guides haven't.
- ToolOgden Home FinderA living catalogue of Ogden-metro rentals and for-sale homes — tracked daily with price history, days on market and a map. An AI agent scrapes it every morning; a validation gate checks the agent’s work before anything ships.
- The press release became a split test.Pinterest, Atlassian, Anthropic, and CrowdStrike each printed an AI feature alongside a labeled lift number this fortnight — the same disclosure shape, written by four vendors who would not name each other.
- The Restructuring Wave Is Running Two Operations. Most Résumés Are Only Reading One.The May 2026 AI restructuring wave is cutting analytics roles at the mid-level and opening them at the senior IC tier simultaneously — and reading both signals off the same headlines is the week's first career move.
- ToolBrowser GIF & Meme MakerPanel layouts and caption templates for your own pictures, with Impact text you can drag anywhere — or turn a screen recording into a platform-sized GIF with trim, boomerang playback, filters, and client-side ffmpeg. Nothing is uploaded.
- The audit log became the moat.Salesforce printed Agentforce at $1.2B ARR, Snowflake bought Natoma, and Microsoft made Agent 365 mandatory at five agents — three vendors quietly naming the same moat: identity and audit at the tool-call level.
- ToolAI Feature Cost EstimatorSize the monthly bill for an LLM feature before you build it. Requests, tokens, and rates in — cost per request, monthly, and annual out.
- ToolEval Set SizerHow many golden examples do you actually need? Pick a target accuracy, a margin of error, and a confidence level — get the sample size.
- ToolProse Voice LinterPaste a draft. It flags the banned words, exclamation points, and passive voice, then checks the short-declarative rhythm — the exact house rules behind Signal and Crafting.
- ToolA/B Test CalculatorDrop in visitors and conversions for two variants to see lift, a p-value, and whether the result is real. Plus a planner for how many you need before you start — and, for training rollouts, a holdout sizer and a pre/post difference-in-differences reader.
- Analytics Leadership Has a Build Brief and a Scale Brief. They're Not the Same Interview.The analytics leadership pool is about to get bigger. Meta's notice periods clear in mid-June, and most of that clearance lands at the Director and Head of Analytics tier.
- The agent moved inside the suite.Anthropic shipped Claude inside Microsoft Office. SAP turned 200 workflows into agents. The standalone AI tab is being demoted; the integration is taking the seat.
- The Senior Analyst Brief Has Split. Most Résumés Address the Half That Isn't Hiring.The Senior / Staff Data Analyst title is running two separate job briefs right now. The product analytics version has been the default. The advertiser measurement version is the active hire.
- AI revenue is becoming a line item.Salesforce is about to break out Agentforce ARR as its own segment. Every competitor's CFO is drafting the same slide. The renewal sheet just grew a column.
- The dashboard stopped being the product.Four BI vendors moved the same direction last week. The semantic layer is the new product surface. The dashboard is the fallback.
- The Director Brief Has a New Question. Most Résumés Are Still Answering the Old One.Three weeks out from Snowflake Summit. The Director interview shifted from 'tell me about your stack' to 'tell me about a decision you changed.'
- Product Analytics Is the Q2 Hire. Here's What the Brief Now Requires.The companies that named AI revenue in Q1 now have a Q2 problem: proving it. That proof is a hiring event.
- The Cuts Are Priced In. The Build-Out Isn't.Meta's 8,000-person reduction is underway. The Q1 ad-platform prints sorted the sales-ops job market into two columns.
Proof, by the numbers
Tell me the problem
Here from a role page
Tell me about the req and I’ll reply with a scope, not a sales call — the 90-day build, the founding rate, and what the first two weeks would ship.
The decision you’re stuck on, the data behind it, the constraint. I read every note; send a real problem and I’ll reply with a scope, not a sales call. The build and the bench are priced on Work with me. Just here to read? The letters are free, and so is everything on the bench.